How to read the Chart
The Chart shows one configured market together with its current Gunbot trading state.
The top bar shows the Gunbot installation, exchange connection, and pair for the current Chart. If the same market is configured on several accounts, each configuration has its own Chart. On derivatives exchanges with separate hedge sides, USDT-BTC-LONG and USDT-BTC-SHORT also appear separately.
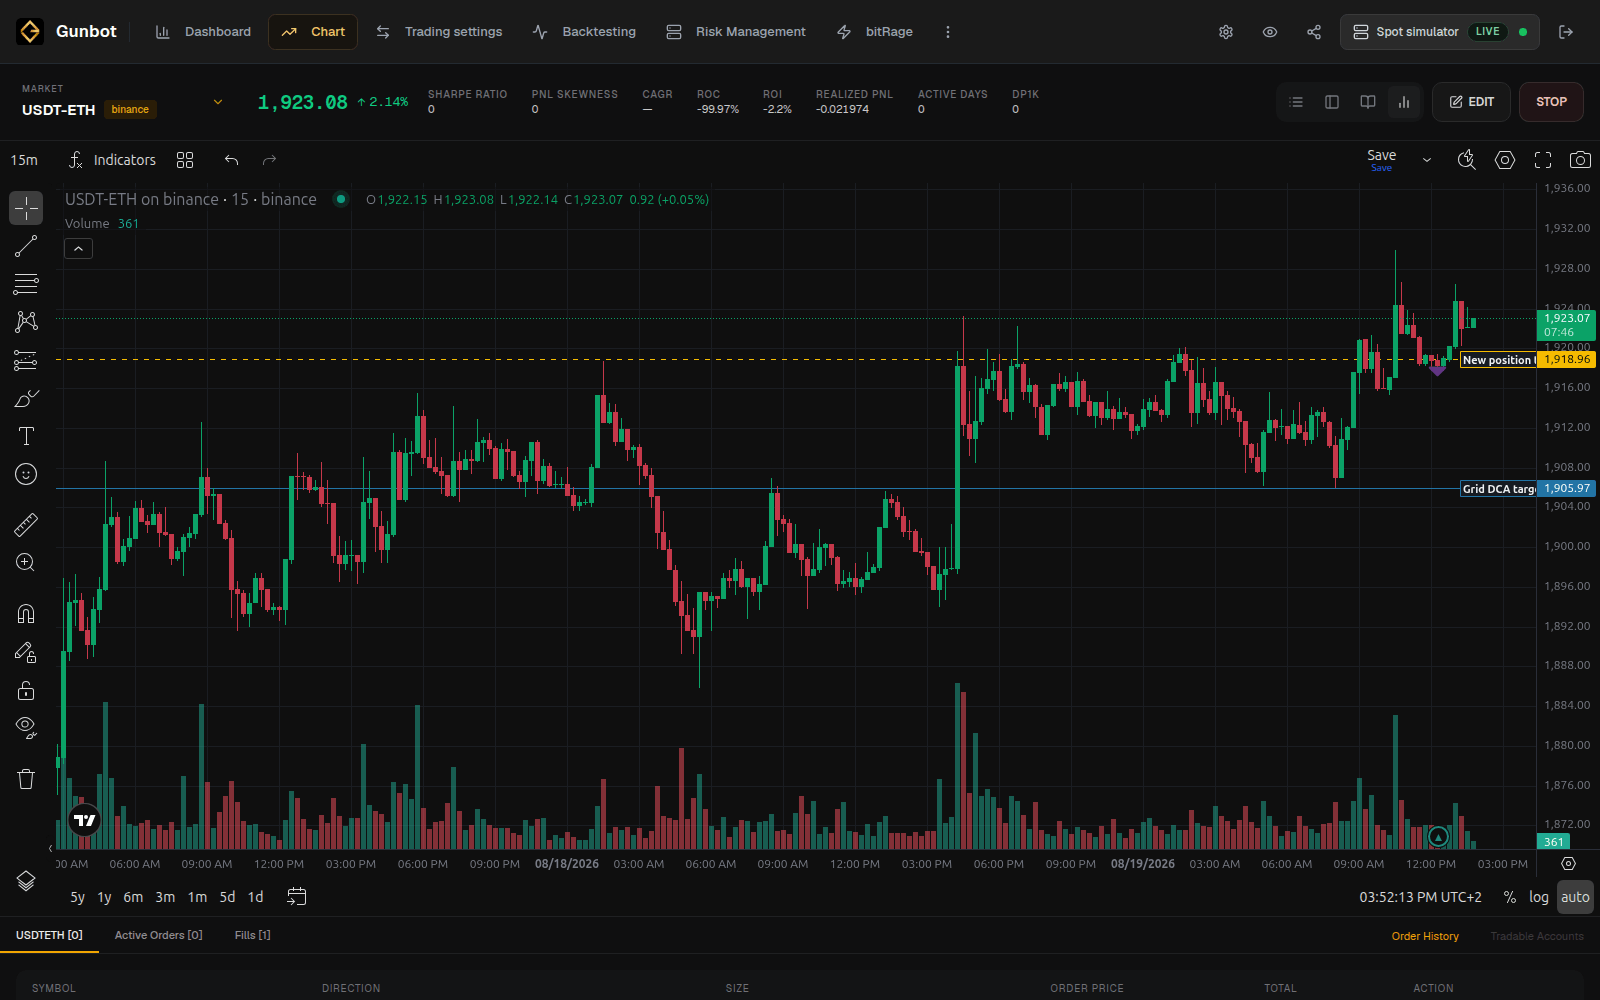
Candle chart
The main chart shows market price and candles. Strategy markers and target lines can appear on top of the chart when the selected strategy exposes them.
Changing the visual chart timeframe only changes what you are viewing. The strategy can use its own configured candle periods for calculations. See Timeframes and order types for more detail.
Current holdings or position
The pair information around the chart shows what Gunbot is currently managing.
On spot, this includes the balances and holdings relevant to the pair, along with strategy-specific break-even or unit-cost information where available.
On futures, the page can show the current position side, size, average entry price, leverage, unrealized profit and loss (P&L), margin information, and liquidation data supported by the exchange.
Strategy targets
Many strategies draw target levels or other markers on the chart. These show levels the strategy is currently using in its logic.
A target is not necessarily an exchange order. Gunbot may still be waiting for price, trailing, confirmation, or another strategy condition before it submits an order.
Use the documentation for the selected strategy to understand its markers. For example, the StepGrid documentation explains its grid steps and trailing behavior.
Active orders and fills
The order area shows the difference between orders that are still open and trading that has already executed.
- Active order: Gunbot or the manual terminal has submitted an order that is still open.
- Fill: all or part of an order executed on the exchange or simulator.
- Target: a strategy level or condition displayed by the strategy, which may exist before any order is submitted.
Open Order History for a longer list of fills and execution details.
Pair settings from the Chart
Select Edit to open the configuration for the current pair without leaving the Chart.
Use Edit to check or change settings such as trading limit, maximum investment, grid spacing, candle period, leverage, or a strategy-specific target.
Open the page for your strategy when you need exact parameter behavior. Manage pairs and strategies covers copying settings, presets, and larger pair-management tasks.
Manual trading
The Chart includes a manual trading terminal for the selected market.
On spot, you can place manual buys and sells. On derivatives markets, the available controls can include long, short, and position-closing actions. Market and limit orders are available where supported by the selected market.
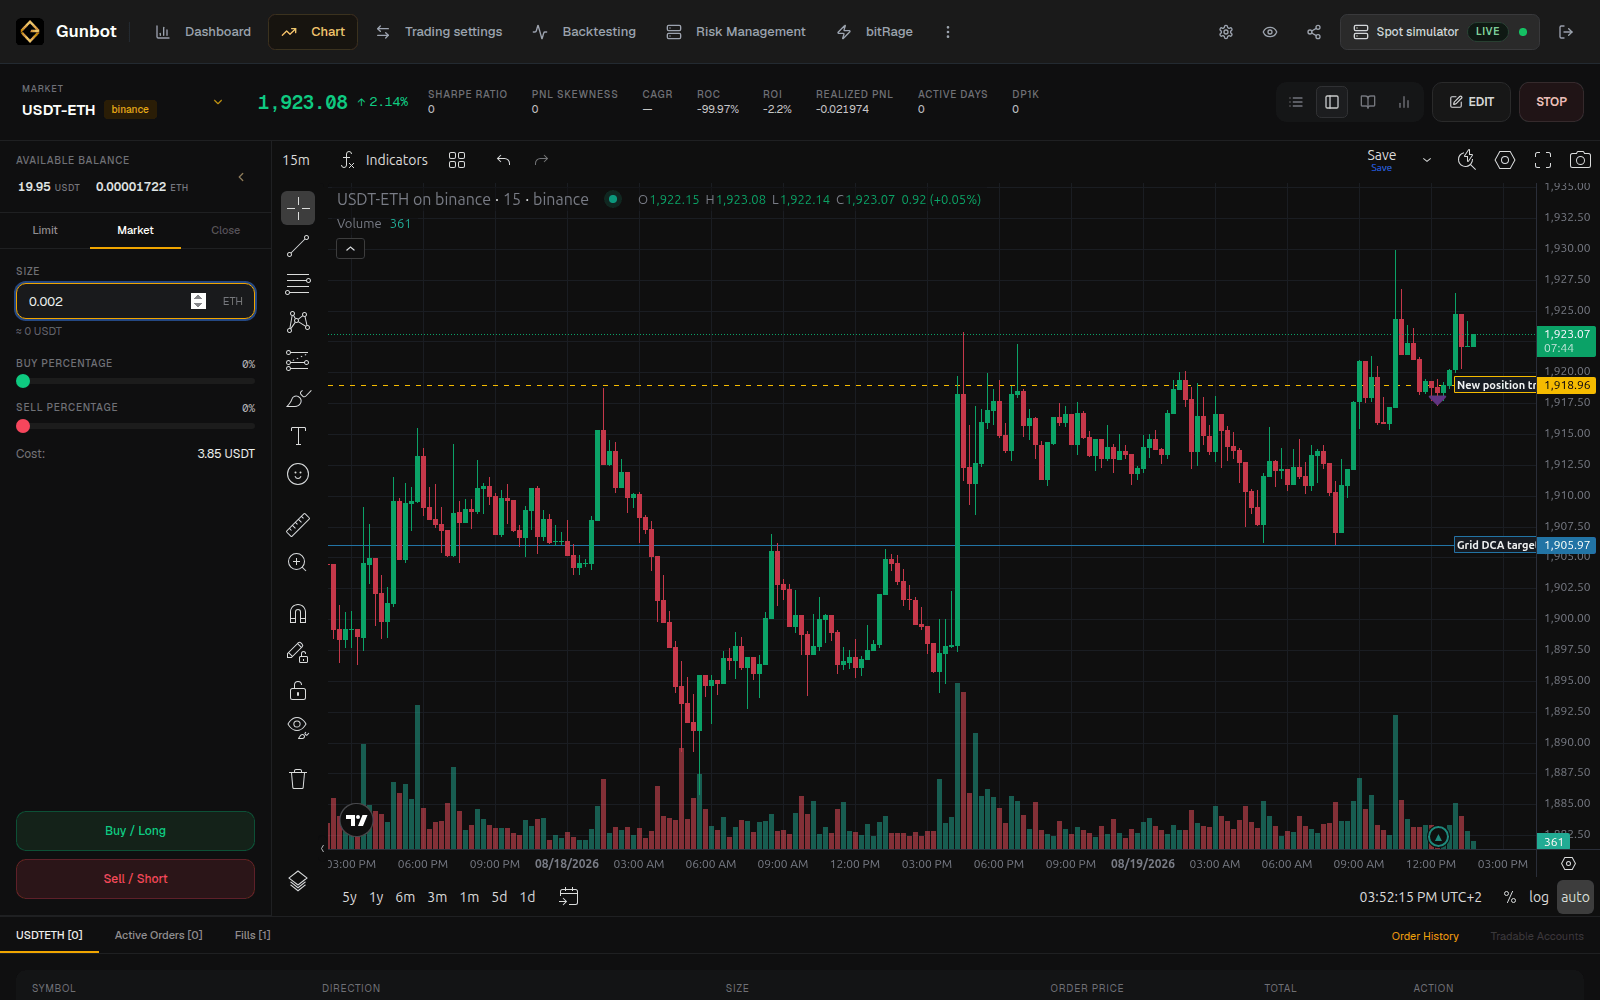
Manual orders can coexist with an enabled Gunbot strategy. The strategy continues from the balances, holdings, positions, and open orders it sees after the manual trade.
If you want Gunbot to stop managing the pair while you trade it manually, disable that pair. You only need to stop the whole Gunbot instance when you want to pause all enabled pairs on that bot.
Manual orders on a real-trading bot use real funds
Check the selected Gunbot instance, exchange, pair, order side, type, and amount before submitting the order.
Manual limit orders and cancel-orders
Gunbot has a global cancel-orders option in Settings > Trading. If you regularly leave manual limit orders open on pairs that Gunbot also trades, consider disabling that option so normal Gunbot order cleanup does not cancel your manual orders.