Backtesting in Gunbot Live
Backtesting runs Gunbot spot and futures strategies against historical market data, including custom JavaScript strategies. Use it to learn how a strategy traded a past period and to compare settings under the same conditions.
Use backtesting to inspect trade behavior quickly before waiting for current markets or using real funds. Historical performance cannot predict future returns.
Run a first backtest
Open Backtesting and choose:
- Exchange for the historical data provider
- Strategy
- Pair / Symbol
- Initial Balance
- Trading Fees
- Start Date and End Date
Then configure the strategy settings and run the test.
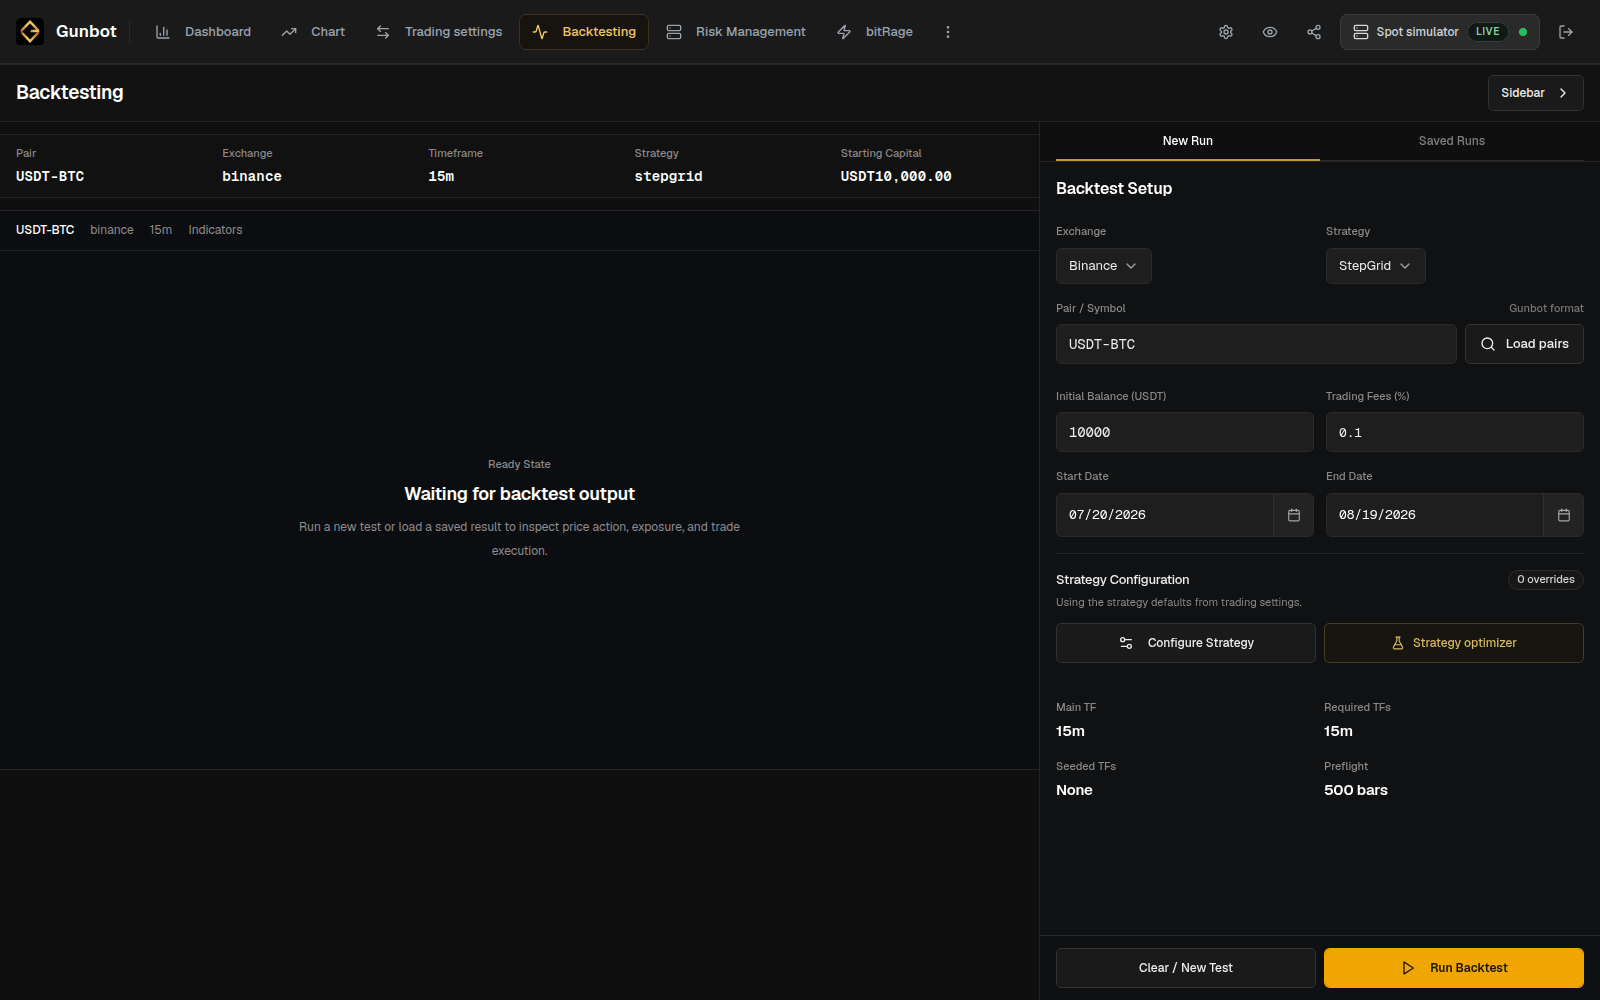
Start with strategy defaults, a saved preset, or another configuration you want to evaluate. If you have not used the strategy before, run more than one market period so a single favorable stretch does not dominate the result.
Historical data providers
Gunbot supports more exchanges for live trading than Backtesting can provide public historical data for.
If your live exchange is not available in the Backtesting exchange list, use the same or a similar liquid market from an available provider. For example, USDT-BTC data from another major exchange can still show how a strategy reacts to comparable BTC price movement.
Exchange prices, liquidity, fees, and execution vary between providers. A substitute provider gives you an approximation of the strategy behavior, not an exact copy of your live account.
Hosted backtesting
On live.gunbot.com, supported strategies can run their backtests on Gunbot servers. The test does not add load to the Gunbot installation that is doing your trading.
Self-hosted Gunbot Live has the same backtesting interface, with the test running from your own installation where supported.
Compare settings from a baseline
Keep the first run you want to compare against as a baseline. When you test a change, keep the provider, market, dates, initial balance, and fee assumption the same.
For a direct comparison:
- run the baseline
- change one setting or one related group of settings
- run the same period again
- compare the trades, drawdown, exposure, fees, and final result
For exact parameter behavior, open the documentation for the strategy you are testing.
Examples include wider versus tighter grid spacing, different order sizes, two saved presets, or a strategy setting that changes how quickly a position grows.
Review the result
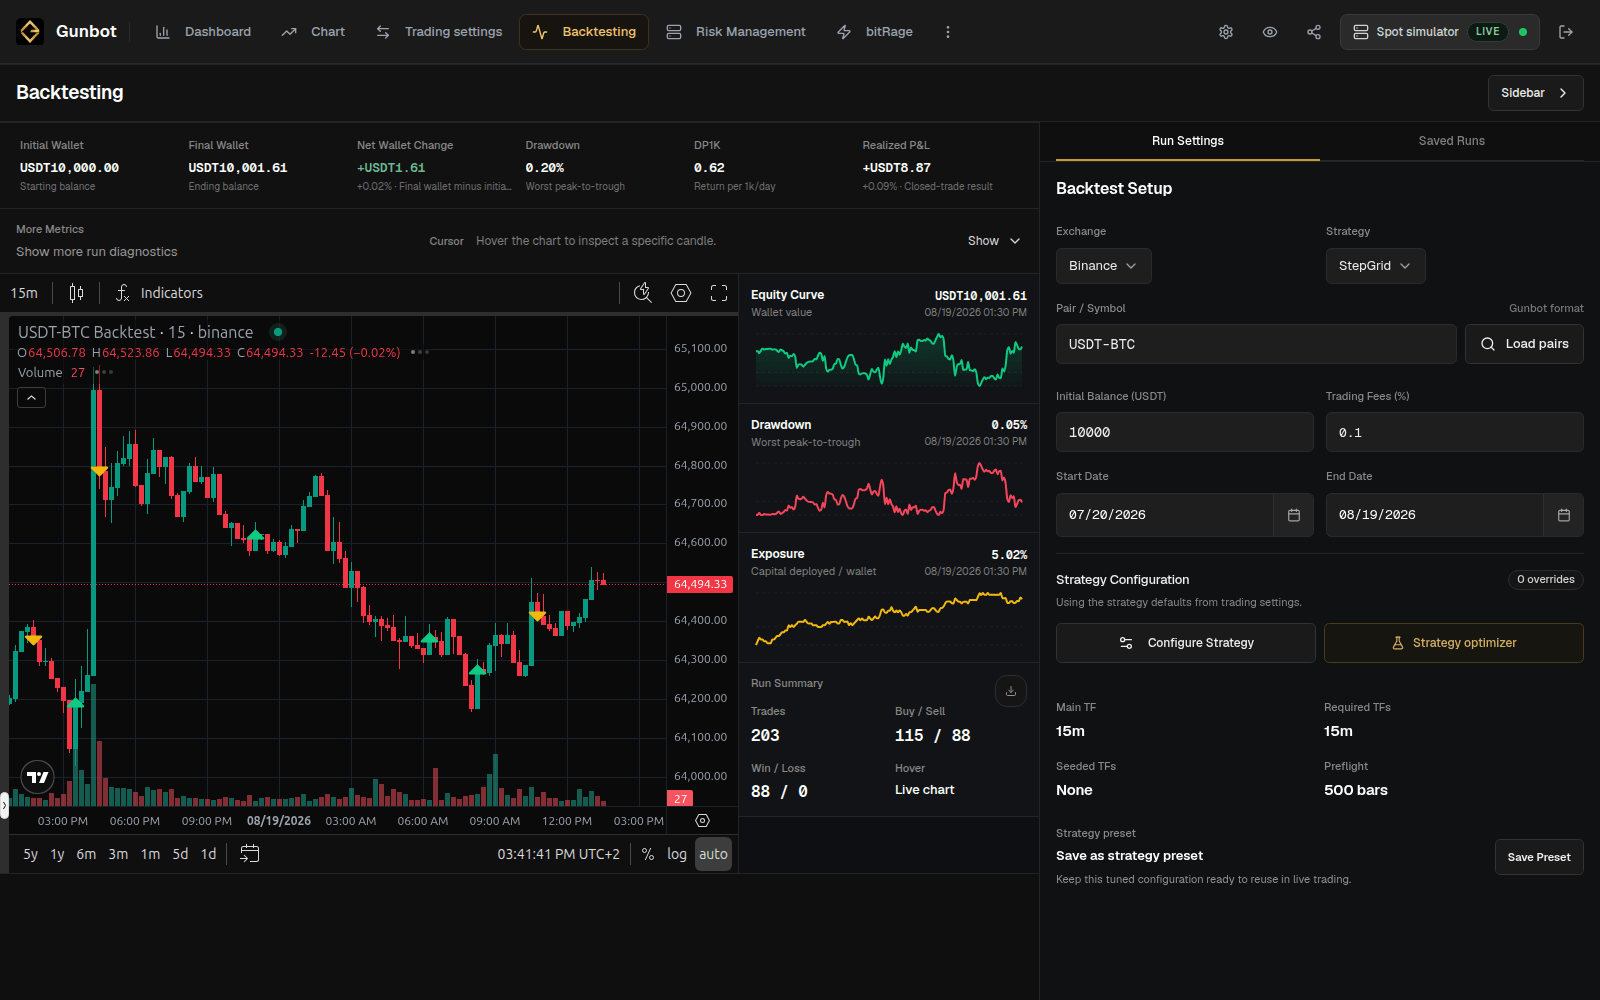
A completed run shows the historical market chart with trade markers, performance charts, summary statistics, and the trade ledger.
Return
Return on investment (ROI) and final wallet value show where the test finished.
Compare them with the path the strategy took to get there. Two setups can finish with similar returns while one uses much more capital or goes through a much larger drawdown.
Drawdown
Maximum drawdown shows the largest decline from a previous balance peak during the test. Where available, also check how long the balance stayed below its previous high.
Exposure
Average and maximum exposure show how much capital the strategy used during the run.
Compare exposure closely when two configurations use different order sizes or accumulation behavior. A higher return with much higher exposure also means the strategy used more capital.
Fees
Set a realistic trading fee and check the total cost in the result. Strategies that trade frequently can look very different once fees are included.
Trade ledger
The ledger shows the individual entries and exits behind the summary numbers. Use it together with the candle chart to see when orders happened, how the position grew, and how the strategy exited.
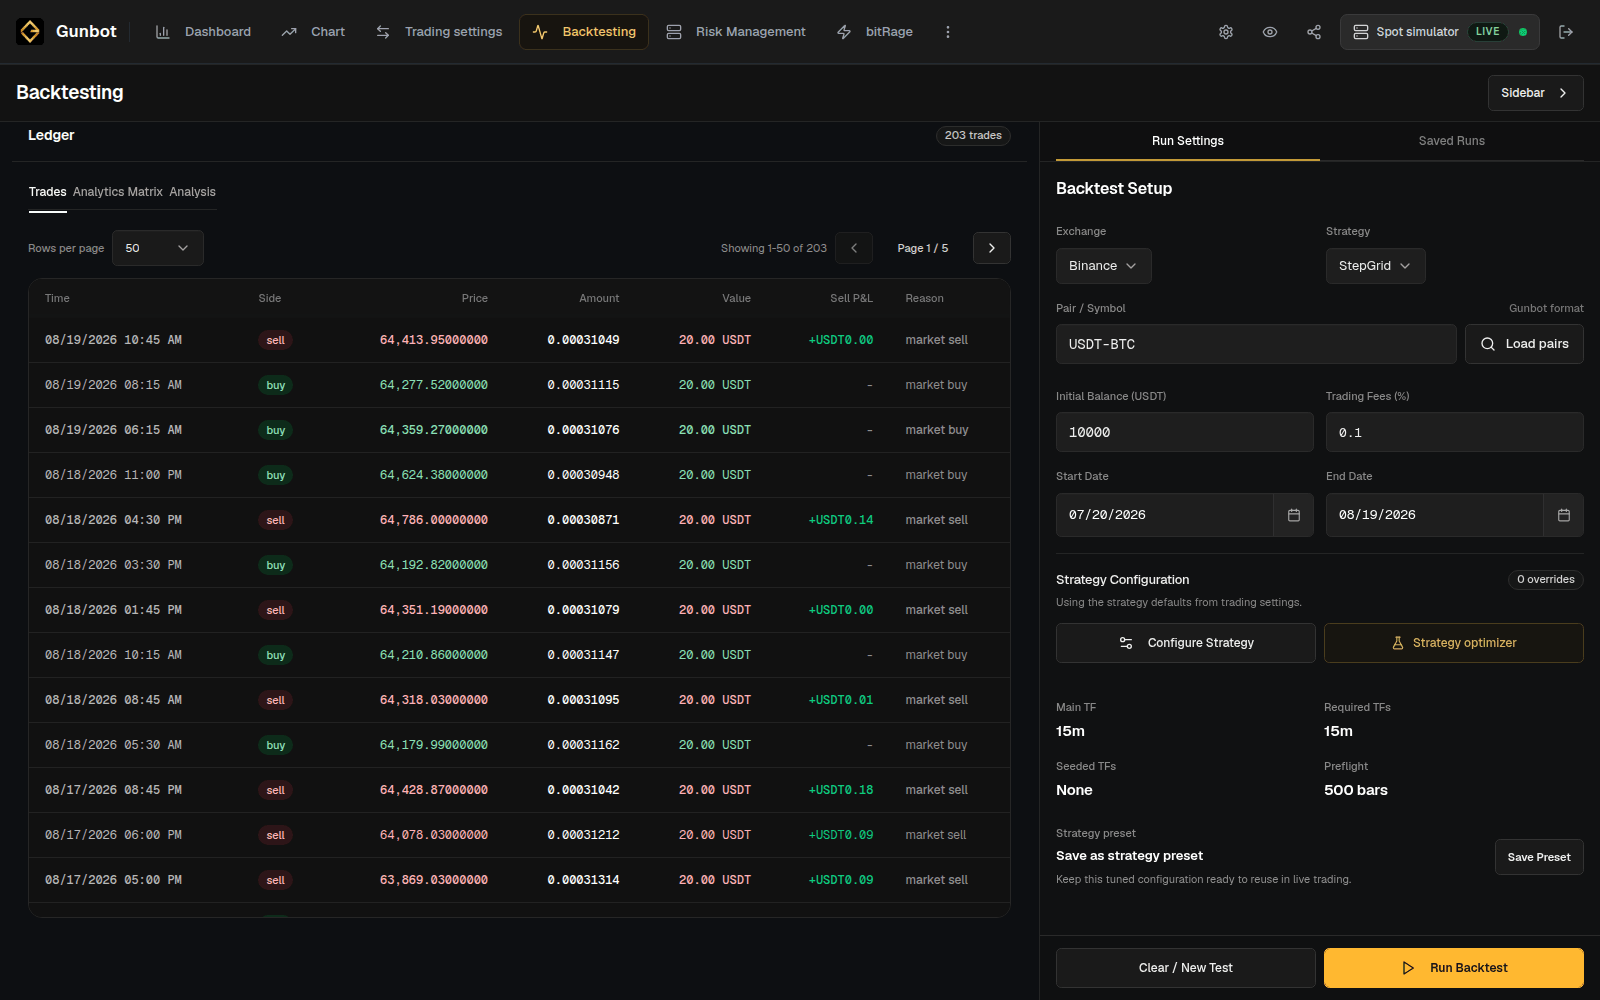
Win rate is only one part of that picture. Check the size of gains and losses as well as the number of winning trades.
Save runs for later comparison
Backtest History can save results in the current browser. Give saved runs names that make them easy to recognize later, for example:
stepgrid-btc-baseline-6m
stepgrid-btc-wider-grid-6m
Saved runs are browser-local. Another browser or device has its own saved-run library.
Save the baseline and the alternatives you may want to compare again. You can also save a strategy configuration as a preset for later trading setup.
If you start from a configuration on the public Gunbot leaderboard, backtest it on the market and periods you care about before using it on a trading bot.
Tuning and robustness tools
Gunbot Live also includes tuning, sensitivity, robustness, execution-stress, and validation tools.
Use these tools after you have a baseline and want to test small parameter changes, different periods, or less favorable assumptions. Ordinary backtests are enough when they already answer the comparison you are making.
Large parameter searches can easily find a configuration that looks unusually good on one historical sample. Check the resulting trades, exposure, and drawdown before keeping a tuned candidate.
Futures backtesting
Simulator mode is spot-only, while Backtesting supports Gunbot spot and futures strategies, plus custom JavaScript strategies for spot and futures.
A futures test can show long and short trades, position sizing, leverage effects, fully simulated futures margin mechanics, drawdown, and the trade sequence on the historical chart. See Futures in Gunbot Live and the documentation for the futures strategy you are testing.
After a backtest
For a spot strategy you have not run before, Simulator mode can forward-test the setup against current market data over real hours or days.
If you already know the strategy and the historical tests give you enough information, you can add the reviewed setup to your real-trading instance with the position size you want to use.
Keep the simulator available for later tests and put reviewed setups on the separate real-trading instance.
Backtests simplify real execution
Historical tests cannot reproduce every live execution detail. Spread, slippage, partial fills, latency, exchange limits, outages, fees, funding, and future market conditions can differ from the backtest.