Chart interface
Open page: https://live.gunbot.com/chart/
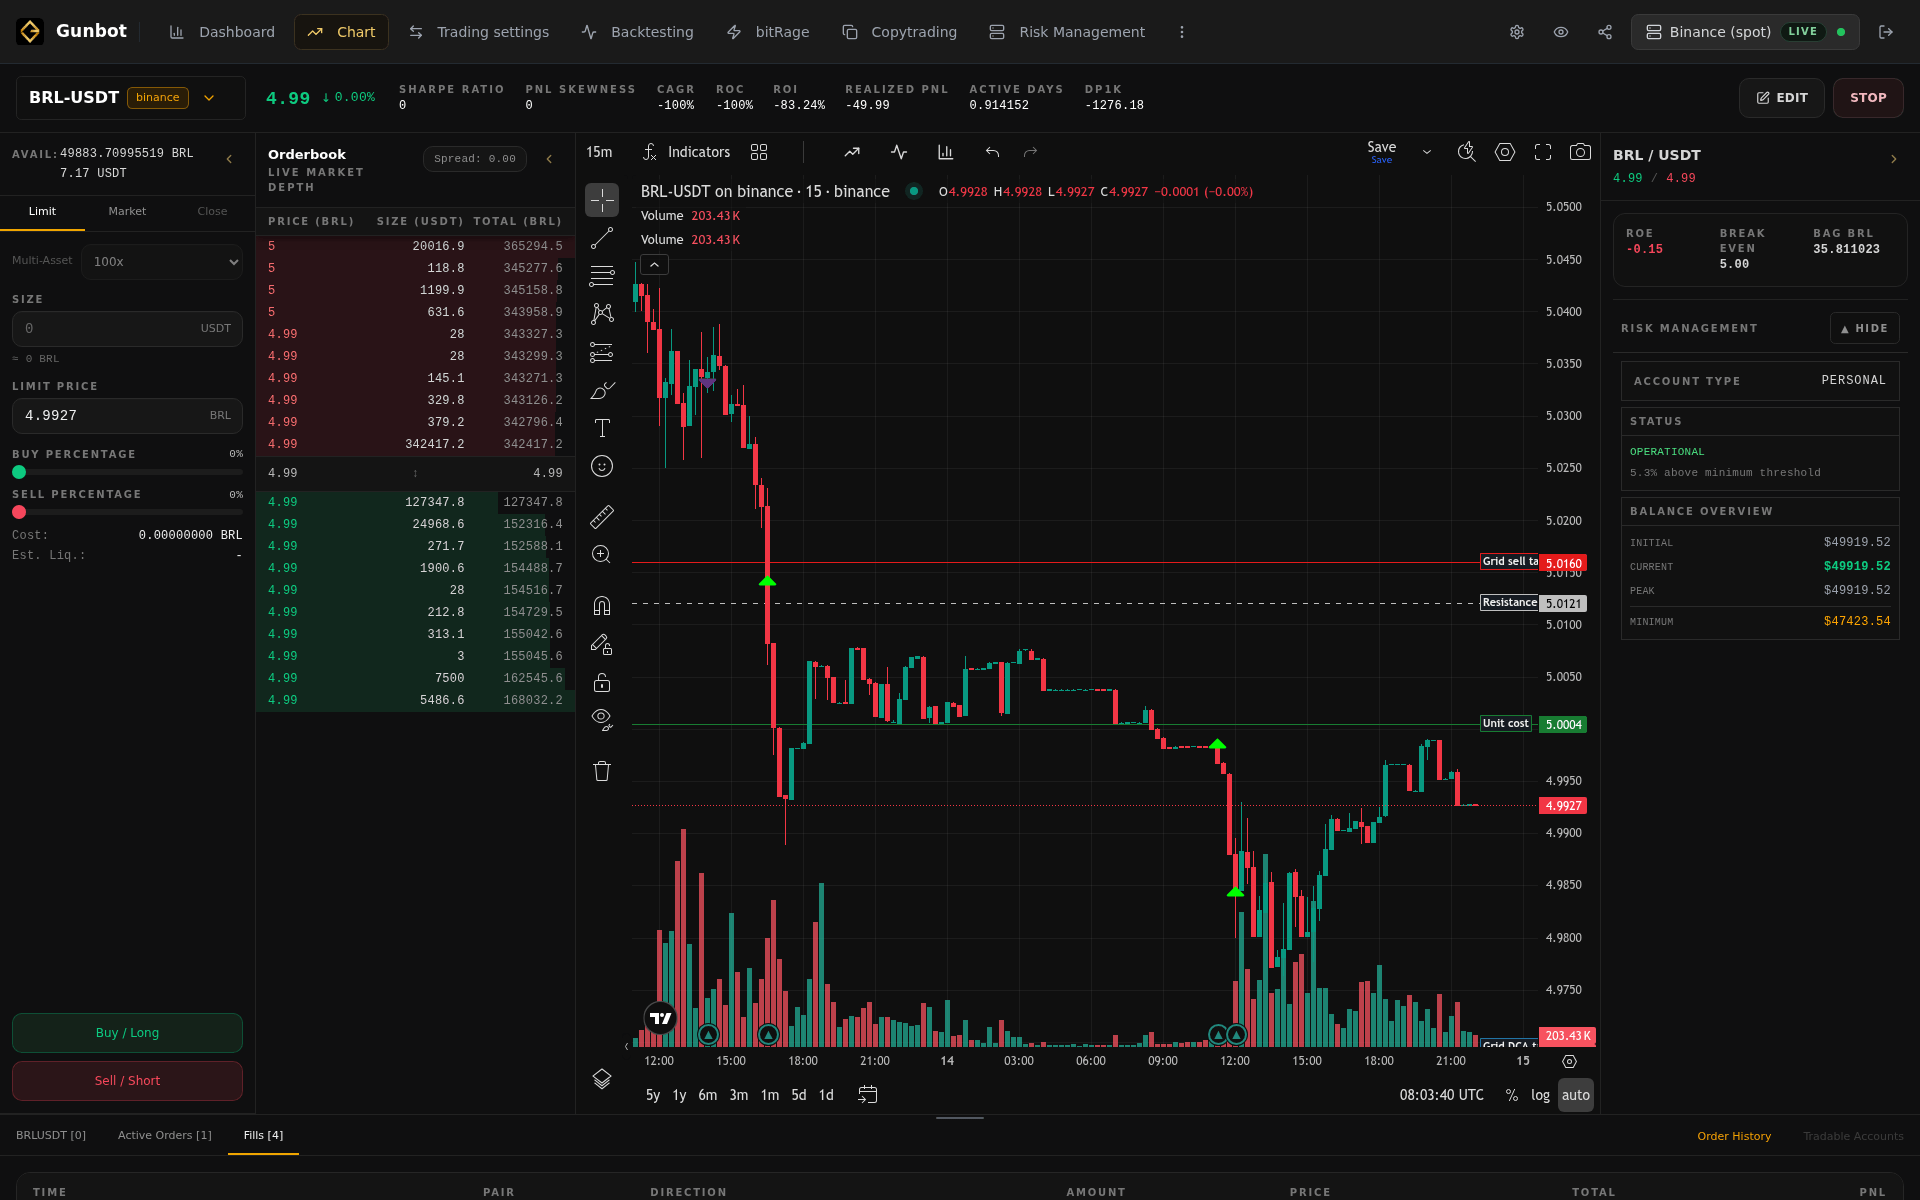
The Chart page is the main workspace for one selected pair. It shows market movement together with Gunbot activity, so you can see what the bot did and where it happened.
What you can do here
Use Chart when you want to inspect a pair in detail:
- Watch candles and indicators for the selected market.
- See trades and orders visually on the chart.
- Review open orders, recent fills, and current position context.
- Start or stop the selected pair when needed.
- Open the pair settings for deeper configuration work.
This is the page for understanding behavior. Dashboard tells you which pair deserves attention. Chart shows what happened.
Visual trade review
The chart can show bot trades directly on the price view. This is useful after a strong move, a surprising entry, a missed exit, or a period where the pair seems inactive. Seeing trades on the chart is often clearer than reading a table because timing, price, and market structure are visible together.
Use the chart to ask: did the bot trade near the expected area, did it wait through a trend, did it react late, or did an open order sit away from the current market?
Pair state and controls
The header gives the selected exchange, pair, and current bot state. Start, stop, and pair-edit controls are nearby because this page is where you usually notice that a pair needs action.
Status labels help explain why the chart may not be updating as expected. A pair can be configured but still waiting for candle data, delayed by settings, stopped, or not ready yet.
Orders and fills
The order and trade panels help you separate completed activity from pending activity. An open order may need attention if it is far from current price, has been sitting longer than expected, or no longer matches what you expect from the strategy.
Use the table with the chart, not instead of it. The table gives exact order details. The chart gives context.
Pair statistics
Pair statistics show how this market is behaving inside the bot. Use them to understand recent performance, risk context, and current state before changing settings.
How Chart fits the workflow
Use Chart after Dashboard points to a pair, after changing a strategy in Trading Settings, or after a backtest gives you an idea to test live with a small scope. It is also the best place to review the first trades after a change.