Dashboard interface
Open page: https://live.gunbot.com/dashboard/
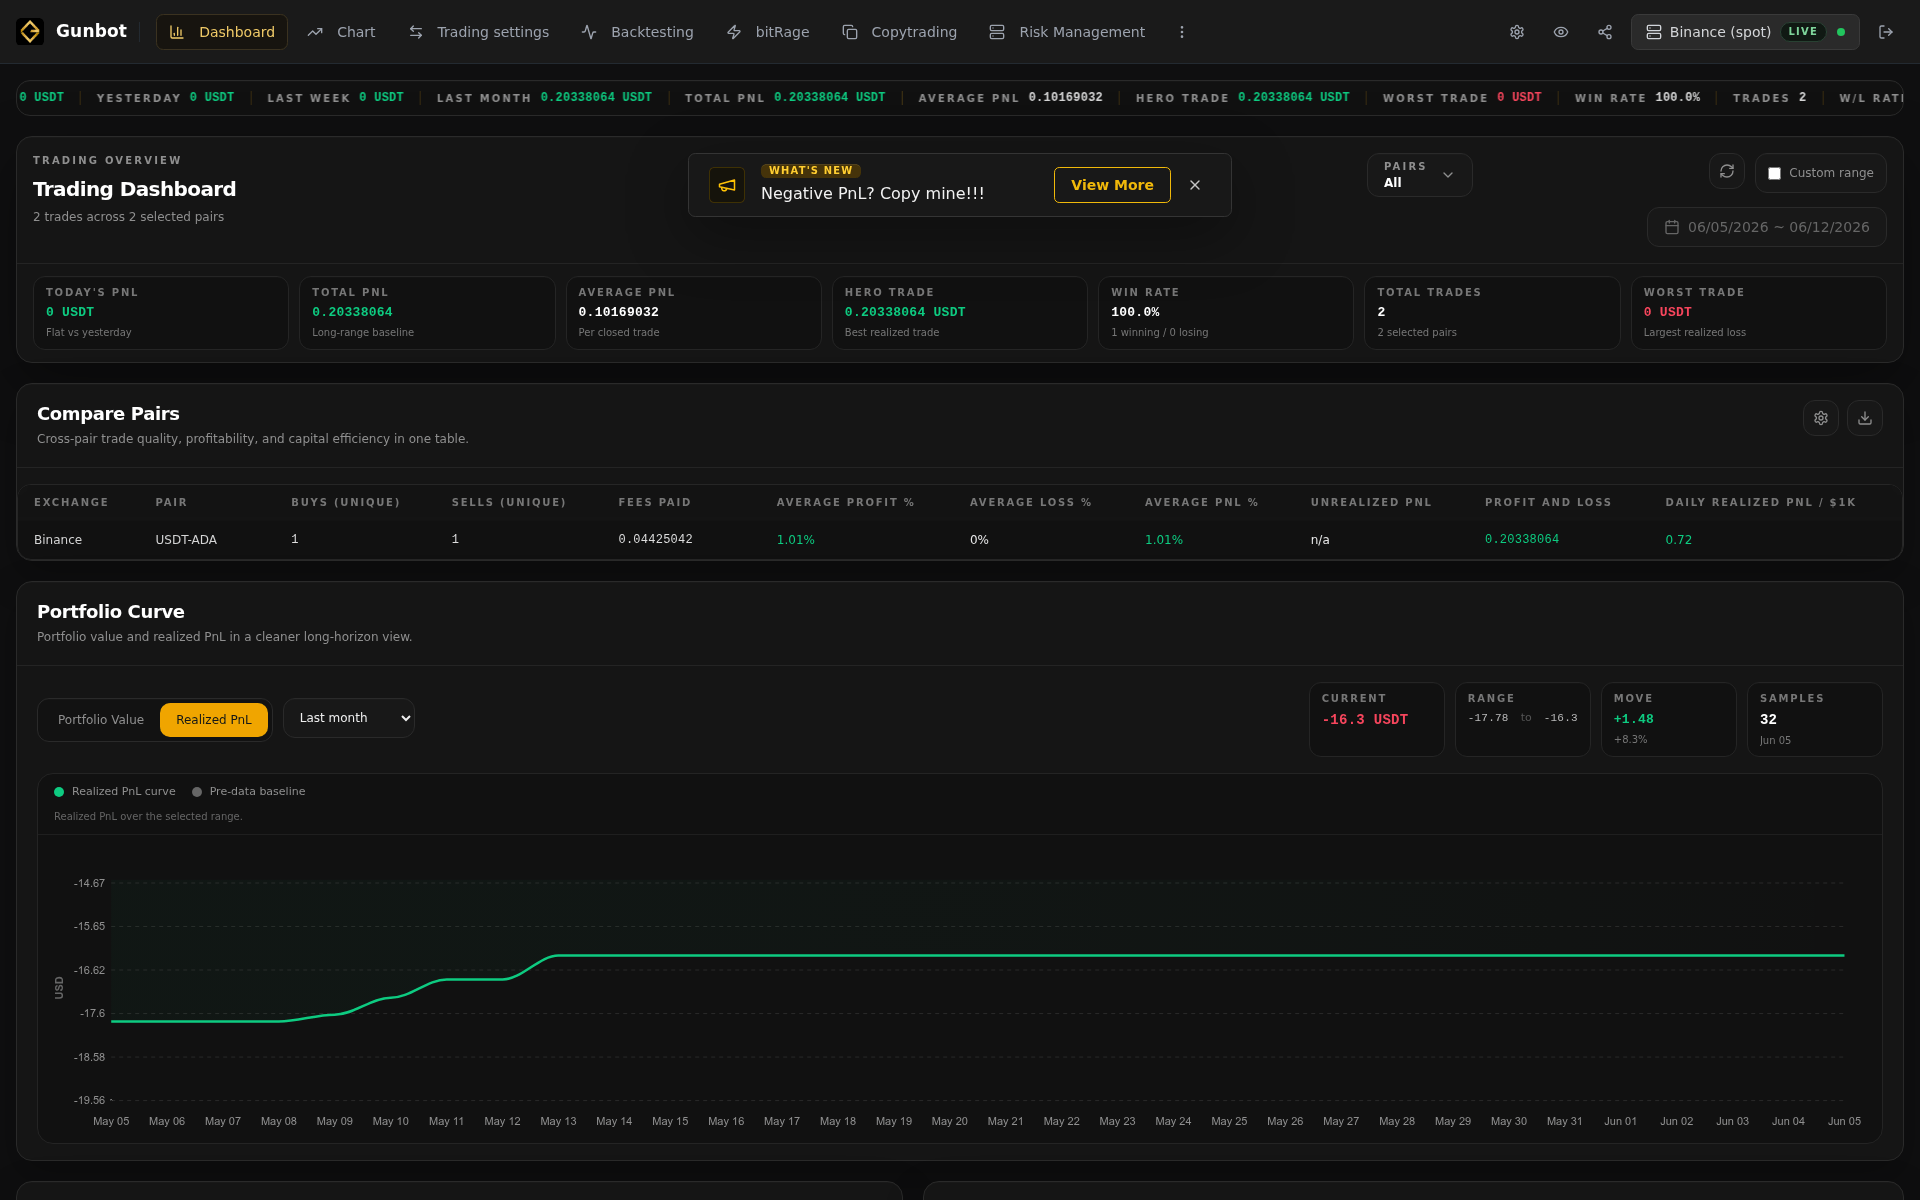
The Dashboard is the fastest way to understand how your connected Gunbot instance is performing. It brings account value, daily results, pair comparison, trade activity, and configurable columns into one review page.
What you can do here
Use the Dashboard to answer practical trading questions:
- Which pairs are active right now?
- Which pairs are contributing most to profit or drawdown?
- Which strategies are used across the account?
- How did the account move over the selected period?
- Which trades should be reviewed on the Chart page?
The page is not for editing strategies. It is for deciding where to look next.
Performance overview
Start with the summary cards and charts. They give you a quick read on account movement, recent profit and loss, assets, and trading activity. The goal is not to study every number. The goal is to see whether the account looks normal, improving, flat, or under pressure.
Use the date range control when you need a cleaner view. A short period helps you inspect recent behavior. A longer period helps you avoid overreacting to one trade or one volatile day.
Pair comparison
The pair table turns the Dashboard into a review board. Choose the columns that matter for your workflow, then sort the table to bring the strongest, weakest, or most exposed pairs to the top.
Good review patterns include sorting by profit, drawdown, trading activity, balance usage, or strategy name. This helps you find pairs worth checking in Chart, Trading Settings, Risk Management, or Backtesting.
Trade history
The trade history area shows recent executed activity. Use it to connect performance changes with actual bot actions. If a trade looks surprising, open the same exchange and pair on the Chart page so you can see where it happened visually on the candle chart.
How the Dashboard fits the workflow
Use Dashboard first when you want orientation. From there, move to Chart for pair-level detail, Trading Settings to adjust configured pairs, Backtesting to test a strategy idea, or Risk Management when exposure or drawdown needs a closer look.