ATRTS
Average True Range (ATR): ATR is a technical analysis indicator that measures market volatility by decomposing the entire range of an asset price for that period. It does not indicate price trend, only the degree of price volatility.
The Average True Range (ATR) indicator is a tool used to measure market volatility. Developed by J. Welles Wilder Jr. and introduced in his 1978 book, "New Concepts in Technical Trading Systems," ATR calculates the average range of price movement by considering the high, low, and closing prices over a specified period (typically 14 days).
Traders use ATR to assess the risk associated with a trade. A high ATR value signifies greater price fluctuations, indicating higher volatility and potential risk. Conversely, a low ATR value suggests lower price movement and reduced potential risk.
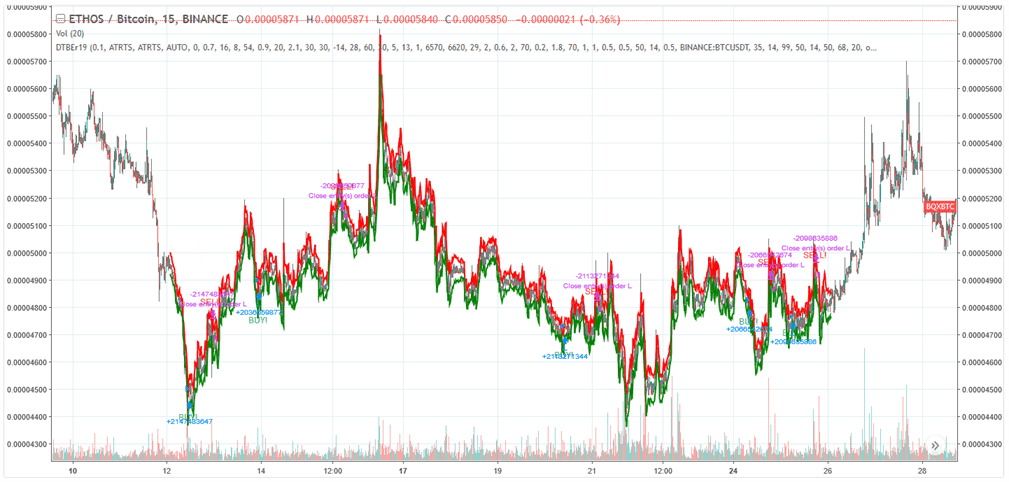
The ATRTS strategy in Gunbot uses ATR to set dynamic trailing stops, automating buy and sell signals based on market volatility. A configurable multiplier, ATRX, is applied to the ATR value to calculate upper and lower threshold lines. The resulting values are effectively the 'ATR long' (upper limit for buys) and 'ATR short' (lower limit for sells) for the strategy. Since ATR only measures volatility and not price direction, using an additional momentum indicator (like RSI) is strongly recommended for more informed trading decisions.
Trailing Stop Calculation
The strategy calculates upper and lower trailing stop levels using the ATR value and the ATRX multiplier:
ATR short(lower limit for sells) is calculated based on subtracting the (ATR *ATRX) value from the bid price.ATR long(upper limit for buys) is calculated based on adding the (ATR *ATRX) value to the ask price.
How It Works
Buy Conditions:
A buy order is triggered when the current ask price crosses above the calculated ATR long limit.
Sell Conditions:
A sell order is triggered when the current bid price crosses below the calculated ATR short limit, provided the price is also above the break-even point (if GAIN is > 0).
Trading Example

Example of potential ATRTS strategy performance. [_Details and settings](https://www.tradingview.com/chart/BQXBTC/CGLIN3ce-ATRTS-Gunbot-trading-strategy/ )_
ATRTS Strategy Settings
Buy Settings
| Label | Config Parameter | Default Value | Detailed Description |
|---|---|---|---|
| Buy enabled | BUY_ENABLED | true | If enabled, allows the ATRTS strategy to place buy (long) orders. |
Sell Settings
| Label | Config Parameter | Default Value | Detailed Description |
|---|---|---|---|
| Sell enabled | SELL_ENABLED | true | If enabled, allows the ATRTS strategy to place sell (short) orders. |
| Gain | GAIN | 1 | Defines the minimum profit percentage above the break-even point required for a sell order to be placed. If set to 0, sells can occur based on ATR signal alone, potentially at a loss. |
| Stop limit | STOP_LIMIT | 99 | Sets a stop-loss threshold. If the price drops by this percentage below the break-even point, a sell order will be triggered to limit losses. A high value like 99 effectively disables it. |
| Count sell | COUNT_SELL | 9999 | Disables trading for the pair after a specified number of sell orders have been executed. Helps manage exposure or cap trades. |
Indicators
| Label | Config Parameter | Default Value | Detailed Description |
|---|---|---|---|
| Period | PERIOD | 15 | Defines the candlestick period (e.g., 15 minutes) used for indicator calculations, including ATR. Ensure the chosen value (in minutes) is supported by your exchange. |
| ATRx | ATRX | 0.5 | The multiplier applied to the ATR value to determine the offset for the `ATR long` (buy) and `ATR short` (sell) threshold lines. Adjusts sensitivity to volatility. |
| ATR period | ATR_PERIOD | 14 | The number of historical periods (candles) used to calculate the Average True Range (ATR). |
Overview of Effects on Different Order Types
| Config Parameter | Affected Order Types | Not Affected Order Types |
|---|---|---|
| Buy Enabled | Strategy buy, DCA buy, RT buy, RT buyback | Strategy sell, Stop limit, Close, RT sell |
| Sell Enabled | Strategy sell, Stop limit, RT sell | Strategy buy, RT buy, RT buyback, Close, DCA buy |
| Gain | Strategy sell | Strategy buy, RT buy, RT buyback, RT sell, Close, DCA buy, Stop limit |
| Period | Strategy sell, Strategy buy, DCA buy (when using an indicator) | RT buy, RT buyback, RT sell, Close, Stop limit |
| ATRx | Strategy sell, Strategy buy | RT buy, RT buyback, RT sell, Close, Stop limit, DCA buy |
| ATR Period | Strategy sell, Strategy buy | RT buy, RT buyback, RT sell, Close, Stop limit, DCA buy |