BB
Bollinger Bands are a technical analysis tool that measures relative high and low prices. They consist of three lines: a simple moving average, an upper band, and a lower band. The upper and lower bands are plotted two standard deviations away from the simple moving average.
Traders commonly use Bollinger Bands to identify overbought and oversold conditions in the market. When prices move close to the upper band, it indicates that the market is overbought, and when prices move near the lower band, it suggests that the market is oversold. As a result, traders can use this information to make buy and sell decisions.
Using Bollinger Bands in Gunbot, you can configure the percentage at which to trigger trades. Specifically, you can set the percentage from the lower Bollinger Band at which to buy, and the percentage from the upper Bollinger Band at which to sell. Once prices meet the predetermined distance from the bands, orders are automatically placed by Gunbot.
How to work with it
Buy method conditions
A buy order is allowed when price is below the lower band, and additionally price is at least buy level % below the lowest of EMA1 and EMA2.
Additionally you can use the Low BB setting to change the threshold from the actual lower band, to anywhere between the bands.
Sell method conditions
A sell order is allowed when price is above the upper band. Additionally, the gain % target must be reached.
Additionally you can use the High BB setting to change the threshold from the actual upper band, to anywhere between the bands.
Trading example

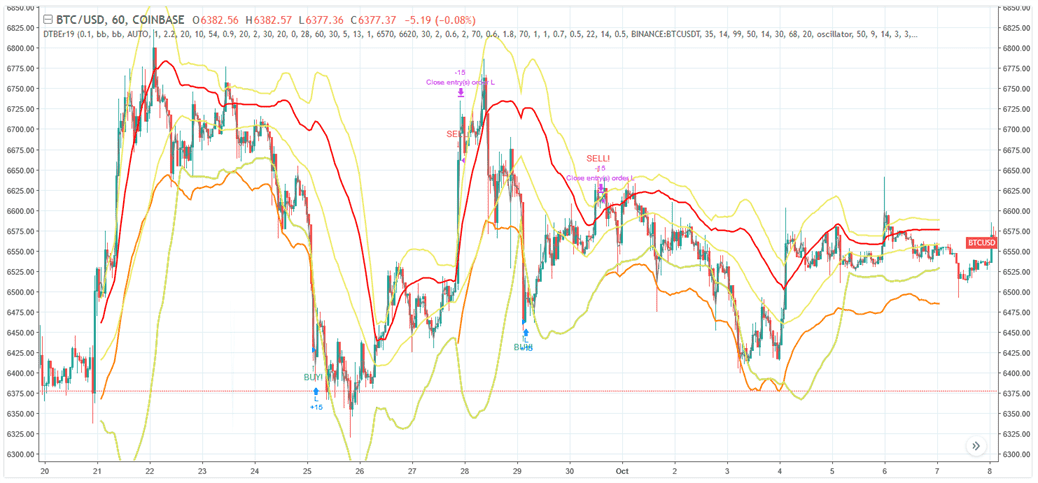
Example of how trading with this strategy can perform. Details and settings.
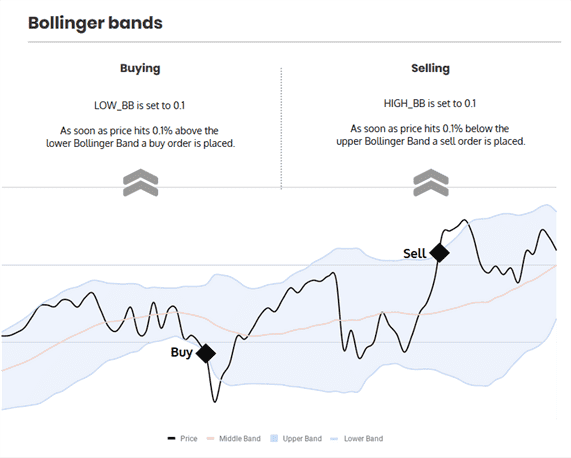
The infographic below describes what triggers trades with this strategy.

Note that this description is kept simple intentionally. In reality prices also need to be below BUY_LEVEL before a buy is triggered.
Strategy settings for BB
Buy settings
| Label | Config Parameter | Default Value | Detailed Description |
|---|---|---|---|
| Buy enabled | BUY_ENABLED | true | Enables the ability to place buy or long orders. When enabled, you can initiate buy transactions based on your strategy conditions. |
| Buy level | BUY_LEVEL | 1 | Sets the buy level as a percentage below the lowest EMA where buy orders are permitted. You can adjust this value between 0.1% to 5%, allowing flexibility in response to market conditions. |
| Low BB | LOW_BB | 0.1 | Defines the target percentage for the lower Bollinger Band, which ranges from the bottom (0%) to the top (100%) of the band. This setting helps in determining optimal buy positions based on volatility and prevailing market trends. |
Sell settings
| Label | Config Parameter | Default Value | Detailed Description |
|---|---|---|---|
| Sell enabled | SELL_ENABLED | true | Enables the ability to place sell or short orders. This setting allows you to execute sell transactions when certain predefined conditions of your strategy are met. |
| High BB | HIGH_BB | 0.1 | Sets the target percentage for the upper Bollinger Band, indicating sell positions from the top (0%) to the bottom (100%) of the band. Adjust this to fine-tune your selling strategy based on market movements. |
| Gain | GAIN | 1 | Specifies the gain target above break-even as a percentage, guiding when to execute sell orders to achieve profits. You can configure this value from 0.1% to 5%, optimizing your profit-taking strategy. |
| Count sell | COUNT_SELL | 9999 | Limits the number of sell orders for a trading pair after which the pair is disabled. You can set this number from 1 to 50, providing control over your exposure and trading frequency. |
Indicators
| Label | Config Parameter | Default Value | Detailed Description |
|---|---|---|---|
| Period | PERIOD | 15 | Configures the candlestick period, in minutes, used for calculating indicators. Make sure to use a period supported by your exchange. This setting is crucial for aligning your strategy with the specific time frames of the market. |
| SMA period | SMAPERIOD | 30 | Determines the number of candles used to calculate Simple Moving Average (SMA), which is key for identifying Bollinger Bands, trend watching, and other indicators like support/resistance levels and Fibonacci retracements. |
| Standard deviation | STDV | 2 | Sets the standard deviation multiplier for Bollinger Bands calculation, influencing how the bands widen or tighten in response to market volatility. You can adjust this setting from 0.5 to 3 to suit different market conditions. |
| Medium EMA | EMA1 | 16 | Specifies the number of candles used to calculate the medium Exponential Moving Average (EMA), important for smoothing data and identifying the direction of the medium-term market trend. |
| Fast EMA | EMA2 | 8 | Defines the number of candles used to calculate the fast EMA, providing quicker signals for potential price movements and helping to identify short-term trends in the market dynamics. |
Overview of effects on different order types
| Config Parameter | Affected Order Types | Not Affected Order Types |
|---|---|---|
| Buy Enabled | Strategy buy, DCA buy, RT buy, RT buyback | Strategy sell, Stop limit, Close, RT sell |
| Buy Level | Strategy buy | Strategy sell, Stop limit, Close, RT sell, DCA buy, RT buy, RT buyback |
| Sell Enabled | Strategy sell, Stop limit, RT sell | Strategy buy, RT buy, RT buyback, Close, DCA buy |
| Gain | Strategy sell | Strategy buy, RT buy, RT buyback, RT sell, Close, DCA buy, Stop limit |
| Period | Strategy sell, Strategy buy, DCA buy (when using an indicator) | RT buy, RT buyback, RT sell, Close, Stop limit |
| Low BB | Strategy buy | RT buy, RT buyback, RT sell, Close, Stop limit, Strategy sell, DCA buy |
| High BB | Strategy sell, DCA buy (when using HIGHBB option) | RT buy, RT buyback, RT sell, Close, Stop limit, Strategy buy |
| SMA Period | Strategy sell, Strategy buy, DCA buy (when using HIGHBB option) | RT buy, RT buyback, RT sell, Close, Stop limit |
| Standard Deviation | Strategy sell, Strategy buy, DCA buy (when using HIGHBB option) | RT buy, RT buyback, RT sell, Close, Stop limit |
| Slow EMA | Strategy buy | RT buy, RT buyback, RT sell, Close, Stop limit, Strategy sell, DCA buy |
| Medium EMA | Strategy buy | RT buy, RT buyback, RT sell, Close, Stop limit, Strategy sell, DCA buy |