Bollinger Bands Spot Trading Strategy
Understanding Bollinger Bands Components:
- Middle Band: A Simple Moving Average (SMA) of the price over a defined period.
- Upper Band: The Middle Band plus a set number of standard deviations (typically two) of the price over the same period.
- Lower Band: The Middle Band minus the same number of standard deviations. The bands widen during high volatility and narrow during low volatility.
Bollinger Bands are a technical analysis tool used to measure price volatility and identify relative highs and lows. They consist of three main components: a Simple Moving Average (SMA) (the middle band), an upper band, and a lower band. The upper and lower bands are typically plotted a set number of standard deviations (usually two) away from the SMA.
Traders often use Bollinger Bands to identify potential overbought and oversold conditions. When prices approach the upper band, it may suggest an overbought market, while prices nearing the lower band can indicate an oversold market. This information can then be used to inform buy and sell decisions.
In Gunbot's Bollinger Bands strategy, you can configure specific percentage levels relative to the bands to trigger trades. You set a percentage from the lower Bollinger Band (LOW_BB) to define the buy threshold and a percentage from the upper Bollinger Band (HIGH_BB) for the sell threshold. When the price reaches these configured levels relative to the bands, Gunbot can automatically place orders.
How It Works
Buy Conditions:
A buy order is considered when the price is at or below the level defined by LOW_BB (relative to the lower Bollinger Band). Additionally, the price must be at least BUY_LEVEL percent below the lowest of EMA1 and EMA2 (if EMAs are used as an additional filter).
The LOW_BB setting defines how close to the lower Bollinger Band the price must be to trigger a buy. A lower LOW_BB value means closer to the actual lower band.
Sell Conditions:
A sell order is considered when the price is at or above the level defined by HIGH_BB (relative to the upper Bollinger Band). Additionally, the profit target defined by GAIN must be met.
The HIGH_BB setting allows you to fine-tune this sell threshold relative to the upper band.
Trading Example

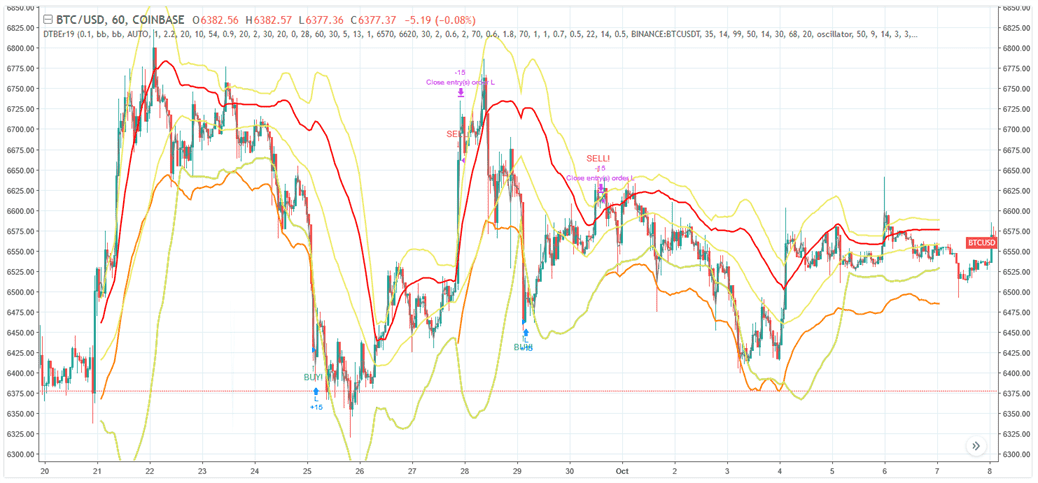
Example of potential Bollinger Bands strategy performance. [_Details and settings](https://www.tradingview.com/chart/BTCUSD/4v7xtwl5-Bollinger-Bands-Gunbot-trading-strategy/)_
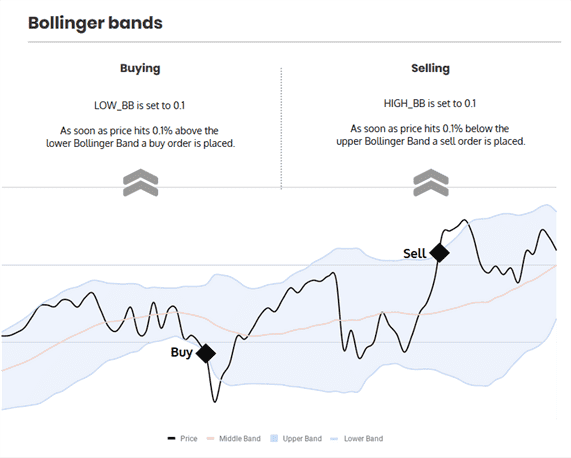
The infographic below describes what triggers trades with this strategy.

This diagram provides a simplified illustration. In an actual setup, conditions like BUY_LEVEL (price relative to EMAs) would also need to be met for a buy to trigger.
Bollinger Bands Strategy Settings
Buy Settings
| Label | Config Parameter | Default Value | Detailed Description |
|---|---|---|---|
| Buy enabled | BUY_ENABLED | true | If enabled, allows the Bollinger Bands strategy to place buy (long) orders. |
| Buy level | BUY_LEVEL | 1 | An additional filter for buys: defines a percentage below the lowest of EMA1 and EMA2. A buy signal from Bollinger Bands will only be acted upon if the price is also below this EMA-defined level. Range: 0.1% to 5%. |
| Low BB | LOW_BB | 0.1 | Defines the buy threshold as a percentage of the distance from the lower band towards the upper band. A value of 0.1 (default) means very close to the lower band. A value of 50 would target the middle band (SMA). |
Sell Settings
| Label | Config Parameter | Default Value | Detailed Description |
|---|---|---|---|
| Sell enabled | SELL_ENABLED | true | If enabled, allows the Bollinger Bands strategy to place sell (short) orders. |
| High BB | HIGH_BB | 0.1 | Defines the sell threshold relative to the Bollinger Bands. A value of 0.1 (default) means very close to the upper band (0.1% *below* the upper band). A value of 50 would target the middle band (SMA). |
| Gain | GAIN | 1 | Defines the minimum profit percentage above the break-even point required for a sell order. Range: 0.1% to 5% (or higher if manually configured). |
| Count sell | COUNT_SELL | 9999 | Disables trading for the pair after a specified number of sell orders. Range: 1 to 50 (as per current doc, check if this range is accurate for your Gunbot version). |
Indicators
| Label | Config Parameter | Default Value | Detailed Description |
|---|---|---|---|
| Period | PERIOD | 15 | Defines the candlestick period (e.g., 15 minutes) used for calculating Bollinger Bands and EMAs. Ensure the chosen value (in minutes) is supported by your exchange. |
| SMA period | SMAPERIOD | 30 | The number of historical periods (candles) used to calculate the Simple Moving Average (SMA), which forms the middle line of the Bollinger Bands. |
| Standard deviation | STDV | 2 | The number of standard deviations to plot the upper and lower bands away from the SMA. Common values are 1 to 3. Higher values result in wider bands. |
| Medium EMA | EMA1 | 16 | The number of periods for the medium-term Exponential Moving Average (EMA1), used as an optional filter with BUY_LEVEL. |
| Fast EMA | EMA2 | 8 | The number of periods for the short-term (fast) Exponential Moving Average (EMA2), used as an optional filter with BUY_LEVEL. |
Overview of Effects on Different Order Types
| Config Parameter | Affected Order Types | Not Affected Order Types |
|---|---|---|
| Buy Enabled | Strategy buy, DCA buy, RT buy, RT buyback | Strategy sell, Stop limit, Close, RT sell |
| Buy Level | Strategy buy | Strategy sell, Stop limit, Close, RT sell, DCA buy, RT buy, RT buyback |
| Sell Enabled | Strategy sell, Stop limit, RT sell | Strategy buy, RT buy, RT buyback, Close, DCA buy |
| Gain | Strategy sell | Strategy buy, RT buy, RT buyback, RT sell, Close, DCA buy, Stop limit |
| Period | Strategy sell, Strategy buy, DCA buy (when using an indicator) | RT buy, RT buyback, RT sell, Close, Stop limit |
| Low BB | Strategy buy | RT buy, RT buyback, RT sell, Close, Stop limit, Strategy sell, DCA buy |
| High BB | Strategy sell, DCA buy (when using HIGHBB option) | RT buy, RT buyback, RT sell, Close, Stop limit, Strategy buy |
| SMA Period | Strategy sell, Strategy buy, DCA buy (when using HIGHBB option) | RT buy, RT buyback, RT sell, Close, Stop limit |
| Standard Deviation | Strategy sell, Strategy buy, DCA buy (when using HIGHBB option) | RT buy, RT buyback, RT sell, Close, Stop limit |
| Slow EMA | Strategy buy | RT buy, RT buyback, RT sell, Close, Stop limit, Strategy sell, DCA buy |
| Medium EMA | Strategy buy | RT buy, RT buyback, RT sell, Close, Stop limit, Strategy sell, DCA buy |