BBTA
Bollinger Bands are a technical analysis indicator that help identify relative high and low prices. Using this information, you can potentially buy at lower prices and sell at higher prices.
The indicator consists of three lines: the middle line is a simple moving average, and the other two lines are plotted above and below it at a certain distance away. This distance is calculated using standard deviation, which measures how much the price has varied from its average value over a given period of time. The wider the distance between the upper and lower bands, the higher the volatility of the price.
To use Bollinger Bands TA as method in Gunbot, you can configure at which percentage from the lower band to buy and at which percentage from the upper band to sell. Orders are placed after the price moves outside the set level and then moves back in. Keep in mind that Bollinger Bands are just one tool among many for analyzing the markets, so make sure you understand how they work before relying on them for trading decisions.
How to work with it
Buy method conditions
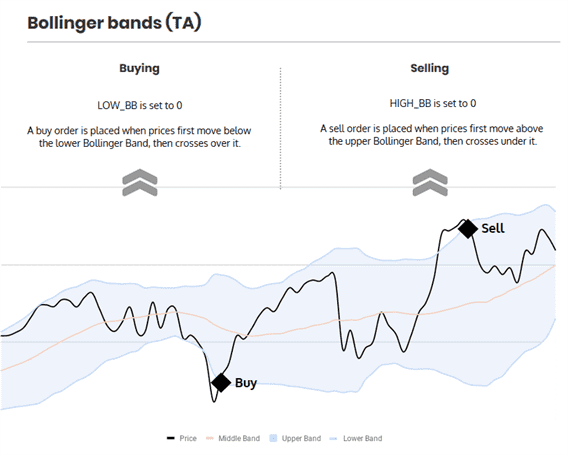
A buy order is allowed when price moves below the lower band, and then moves back in.
Sell method conditions
A sell order is allowed when price moves above the upper band, and then moves back in.
Gain protection is optional for this strategy.
Be aware that this can lead to sell orders below your break-even point.
Trading example

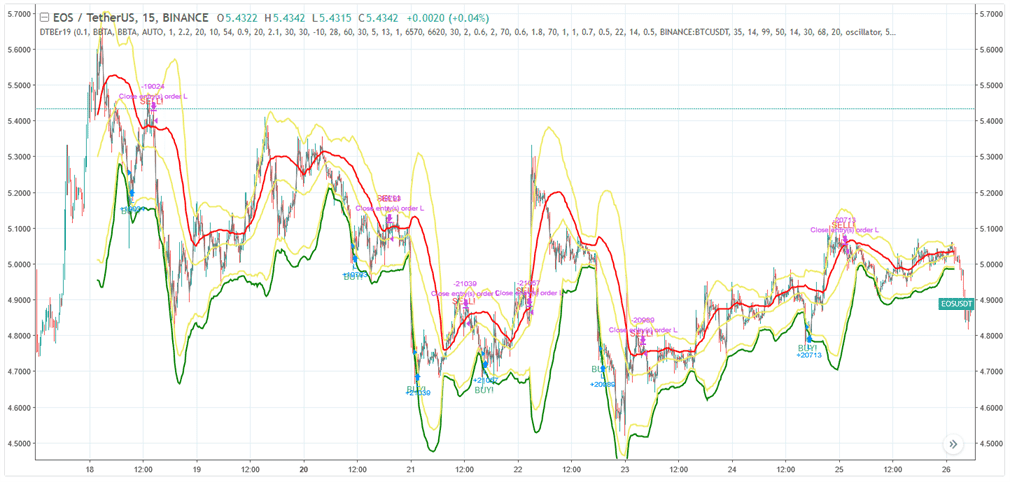
Example of how trading with this strategy can perform. Details and settings
The infographic below describes what triggers trades with this strategy.

BBTA strategy settings
Buy settings
| Label | Config Parameter | Default Value | Detailed Description |
|---|---|---|---|
| Buy enabled | BUY_ENABLED | true | When enabled, this setting allows the strategy to execute buy or long orders. |
| Low BB | LOW_BB | 0.1 | This setting specifies the target for the lower Bollinger Band. The value is a percentage, ranging from 0 to 100, representing the position from the bottom to the top of the band. |
Sell settings
| Label | Config Parameter | Default Value | Detailed Description |
|---|---|---|---|
| Sell enabled | SELL_ENABLED | true | When enabled, this setting allows the strategy to execute sell or short orders. |
| High BB | HIGH_BB | 0.1 | This setting specifies the target for the upper Bollinger Band. The value is a percentage, ranging from 0 to 100, representing the position from the top to the bottom of the band. |
| Double check gain | DOUBLE_CHECK_GAIN | true | This setting ensures that a positive gain is reached before allowing a sell order. Disable this to allow indicators to initiate a sell even at a potential loss. |
| Gain | GAIN | 1 | This setting determines the gain target above the break-even point for a trade. The value is a percentage, indicating how much gain is targeted. |
| Count sell | COUNT_SELL | 9999 | This setting limits the number of sell orders for a trading pair after it has been added. It disables the pair after reaching the specified number of sell orders. |
Indicators
| Label | Config Parameter | Default Value | Detailed Description |
|---|---|---|---|
| Period | PERIOD | 15 | The period setting determines the "size" of the candlesticks used for calculating various indicators. Ensure that the value you choose is supported by your exchange. The value represents the time in minutes. |
| SMA period | SMAPERIOD | 30 | This setting specifies the number of candles used to calculate the Simple Moving Average, Bollinger Bands, and other indicators. It provides a basis for trend analysis and other technical assessments. |
| Standard deviation | STDV | 2 | This setting is used as a multiplier to calculate the width of Bollinger Bands. Adjusting this value changes the sensitivity of the band boundaries to price movements. |
Overview of effects on different order types
| Config Parameter | Affected Order Types | Not Affected Order Types |
|---|---|---|
| Buy Enabled | Strategy buy, DCA buy, RT buy, RT buyback | Strategy sell, Stop limit, Close, RT sell |
| Buy Level | Strategy buy | Strategy sell, Stop limit, Close, RT sell, DCA buy, RT buy, RT buyback |
| Sell Enabled | Strategy sell, Stop limit, RT sell | Strategy buy, RT buy, RT buyback, Close, DCA buy |
| Gain | Strategy sell | Strategy buy, RT buy, RT buyback, RT sell, Close, DCA buy, Stop limit |
| Period | Strategy sell, Strategy buy, DCA buy (when using an indicator) | RT buy, RT buyback, RT sell, Close, Stop limit |
| Low BB | Strategy buy | RT buy, RT buyback, RT sell, Close, Stop limit, Strategy sell, DCA buy |
| High BB | Strategy sell, DCA buy (when using HIGHBB option) | RT buy, RT buyback, RT sell, Close, Stop limit, Strategy buy |
| SMA Period | Strategy sell, Strategy buy, DCA buy (when using HIGHBB option) | RT buy, RT buyback, RT sell, Close, Stop limit |
| Standard Deviation | Strategy sell, Strategy buy, DCA buy (when using HIGHBB option) | RT buy, RT buyback, RT sell, Close, Stop limit |
| Slow EMA | Strategy buy | RT buy, RT buyback, RT sell, Close, Stop limit, Strategy sell, DCA buy |
| Medium EMA | Strategy buy | RT buy, RT buyback, RT sell, Close, Stop limit, Strategy sell, DCA buy |