MACD histogram strategy
This approach relies on the MACD histogram, which is a technical indicator used to track trends. Specifically, it leverages signals that suggest a crossover is probable when the MACD signal line reaches a certain point.
The MACD histogram indicator, short for Moving Average Convergence Divergence histogram, is a popular tool used by traders to identify potential buy and sell signals in a stock's price chart. It is created by subtracting the 26-period exponential moving average (EMA) from the 12-period EMA, resulting in a line that oscillates above and below a zero line. When the MACD line crosses above the signal line (a 9-period EMA of the MACD), it is seen as a bullish signal, while a cross below indicates a bearish signal.
What is MACD Histogram
The MACD histogram takes this analysis one step further by plotting the difference between the MACD line and the signal line as bars above and below the zero line. This makes it easier to identify changes in momentum and confirm trend reversals.
How to work with it
Buy method conditions
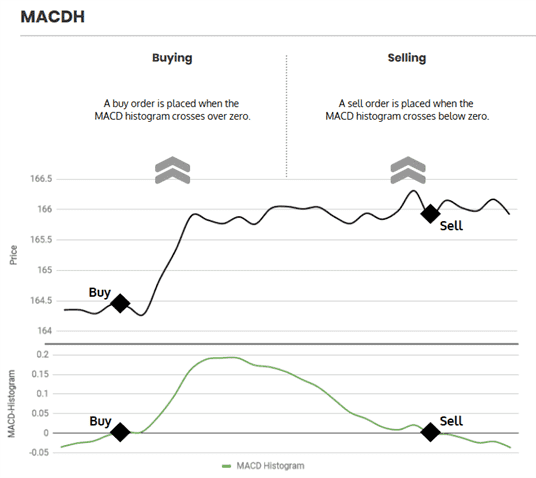
A buy order is allowed when the MACD histogram crosses up the zero line.
Normal constraints like "buy once, sell once" don't apply to this strategy: each time buying criteria occur, Gunbot will place a buy order as high as set in your balance settings.
Sell method conditions
A sell order is allowed when the MACD histogram drops below 0.
Gain protection is optional for this strategy. Be aware that this can lead to sell orders below your break-even point.
Trading example

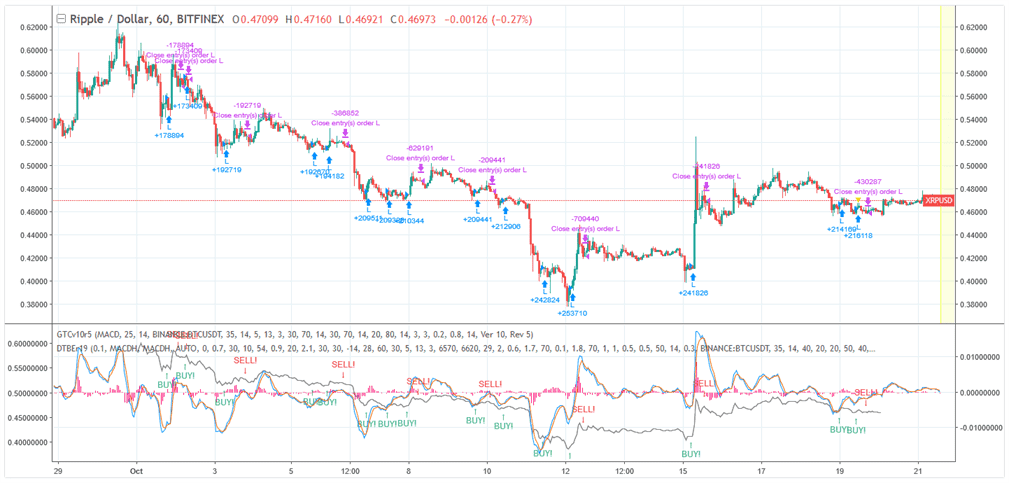
Example of how trading with this strategy can perform. Details and settings
The infographic below describes what triggers trades with this strategy.

Strategy settings for MACDH
Buy settings
| Label | Config Parameter | Default Value | Detailed Description |
|---|---|---|---|
| Buy enabled | BUY_ENABLED | true | Allows you to enable or disable the ability to make buy or long orders. When enabled, buy orders are permitted. |
| Single buy | SINGLE_BUY | false | Enables you to restrict the strategy to only one buy order. If enabled, the strategy will only execute one buy order and then no further buy orders will be permitted. |
Sell settings
| Label | Config Parameter | Default Value | Detailed Description |
|---|---|---|---|
| Sell enabled | SELL_ENABLED | true | Allows you to enable or disable the ability to make sell or short orders. When enabled, sell orders are permitted. |
| Double check gain | DOUBLE_CHECK_GAIN | true | This setting ensures that there is a positive gain before allowing a sell order. If disabled, it allows the indicators to execute a sell order even at a loss, potentially useful in certain strategic scenarios. |
| Gain | GAIN | 1 | This setting targets a gain above break-even, expressed as a percentage. The default value is set at 1%, with adjustable values ranging from 0.1% to 5%. This helps in setting profit goals for each trade. |
| Count sell | COUNT_SELL | 9999 | Limits the number of sell orders for a pair after adding it to the trading strategy. The default setting allows for nearly unlimited sells, but can be adjusted to suit your strategy needs. |
Indicators
| Label | Config Parameter | Default Value | Detailed Description |
|---|---|---|---|
| Period | PERIOD | 15 minutes | The period setting defines the 'size' or duration of candlesticks used for indicator calculation. It's important to use a supported value for your exchange. The default is set at 15 minutes, which is commonly supported for intraday trading. |
| MACD short | MACD_SHORT | 5 | The short-term moving average for the MACD indicator is calculated over the number of candles specified. |
| MACD long | MACD_LONG | 20 | The long-term moving average for the MACD indicator is calculated over a larger number of candles. The default value of 20 provides a broader view of market trends. This setting can be adjusted. |
| MACD signal | MACD_SIGNAL | 10 | This setting specifies the number of candles used to calculate the MACD Signal line. A default setting of 10 provides a balance between sensitivity and reliability. |
Overview of effects on different order types
| Config Parameter | Affected Order Types | Not Affected Order Types |
|---|---|---|
| Buy Enabled | Strategy buy, DCA buy, RT buy, RT buyback | Strategy sell, Stop limit, Close, RT sell |
| Single Buy | Strategy buy | Strategy sell, Stop limit, Close, RT sell, DCA buy, RT buy, RT buyback |
| Sell Enabled | Strategy sell, Stop limit, RT sell | Strategy buy, RT buy, RT buyback, Close, DCA buy |
| Gain | Strategy sell | Strategy buy, RT buy, RT buyback, RT sell, Close, DCA buy, Stop limit |
| Period | Strategy sell, Strategy buy, DCA buy (when using an indicator) | RT buy, RT buyback, RT sell, Close, Stop limit |
| MACD Short | Strategy sell, Strategy buy | RT buy, RT buyback, RT sell, Close, Stop limit, DCA buy |
| MACD Long | Strategy sell, Strategy buy | RT buy, RT buyback, RT sell, Close, Stop limit, DCA buy |
| MACD Signal | Strategy sell, Strategy buy | RT buy, RT buyback, RT sell, Close, Stop limit, DCA buy |