BB (futures)
Bollinger Bands are a technical analysis indicator that help identify relative high and low prices. Using this information, you can potentially buy at lower prices and sell at higher prices.
The indicator consists of three lines: the middle line is a simple moving average, and the other two lines are plotted above and below it at a certain distance away. This distance is calculated using standard deviation, which measures how much the price has varied from its average value over a given period of time. The wider the distance between the upper and lower bands, the higher the volatility of the price.
Using Bollinger Bands in Gunbot, you can configure the percentage at which to trigger trades. Specifically, you can set the percentage from the lower Bollinger Band at which to buy, and the percentage from the upper Bollinger Band at which to sell. Once prices meet the predetermined distance from the bands, orders are automatically placed by Gunbot.
How to work with it
Gunbot will open one position, either long or short, and close this position when the target is reached. When the stop is hit before profitably closing a trade, Gunbot will place a stop order at loss. After closing a position, Gunbot will again look to open a new long or short position. Gunbot will not add to existing open positions.
Please don't manually add to or reduce positions opened by Gunbot, unless you stop running Gunbot on this trading pair until you've closed this position.
Using bb (futures) is only meaningful with MEAN_REVERSION enabled.
The info below assumes you have set this.
The examples below show how the basic triggers for bb work. Additionally, you can use confirming indicators and settings like ROE trailing.
Buy method conditions

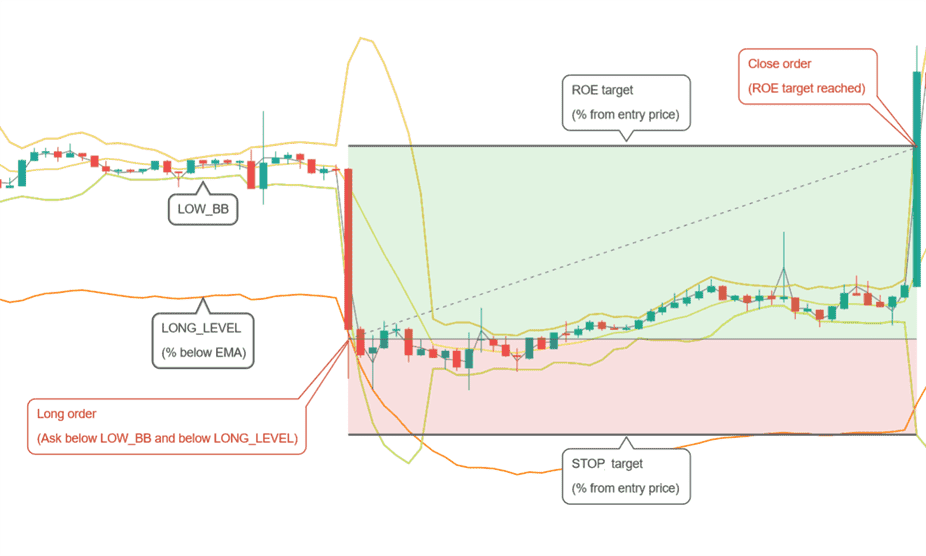
A long position is allowed when the ask price is below LOW_BB and LONG_LEVEL. In the example above LOW_BB would be set to 0, which represents the actual lower Bollinger Band. With different values you could set a target above (positive value) or below (negative value) the lower band.
Sell method conditions

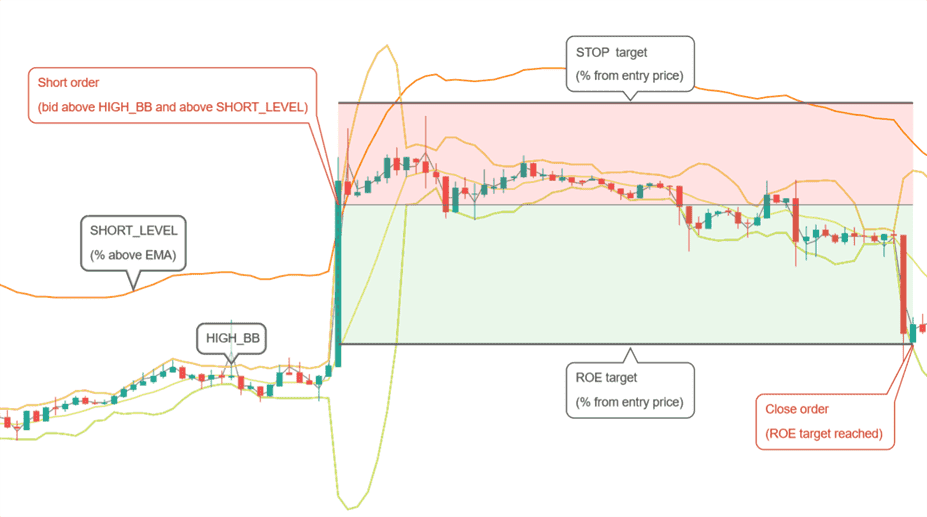
A short position is allowed when the bid price is above HIGH_BB and SHORT_LEVEL. In the example above HIGH_BB would be set to 0, which represents the actual upper Bollinger Band. With different values you could set a target below (positive value) or above (negative value) the upper band.
Conditions to close
Position is closed when the desired ROE (return on equity) is reached. This is a percentage from the entry point, taking leverage into consideration.
Conditions to stop
A position is closed at loss when negative ROE reaches the STOP_LIMIT target.
Strategy settings for BB (futures)
Long settings
| Label | Config Parameter | Default Value | Detailed Description |
|---|---|---|---|
| Buy enabled | BUY_ENABLED | true | When enabled, you can execute buy or long orders within your trading strategy. This setting must be turned on to allow any purchases. |
| Long level | LONG_LEVEL | 1 | This setting determines the percentage distance from the Exponential Moving Average (EMA) at which long orders are allowed. For example, a setting of 1 means that a buy order can be placed when the market price is within 1% of the EMA. |
| Low BB | LOW_BB | 0.1 | This parameter sets the target on the lower Bollinger Band as a percentage from 0% (bottom) to 100% (top) of the band. You can specify how far within the band a price point needs to be to trigger trading actions, such as buying. |
Short settings
| Label | Config Parameter | Default Value | Detailed Description |
|---|---|---|---|
| Sell enabled | SELL_ENABLED | true | When enabled, you can execute sell or short orders within your trading strategy. This setting must be turned on to allow any sales. |
| Short level | SHORT_LEVEL | 1 | Defines the percentage from the EMA where short orders are allowed. For instance, setting this at 1 allows you to place short orders when prices are within 1% of the EMA. This setting depends on your selected sell method. |
| High BB | HIGH_BB | 0.1 | This setting determines your target within the upper Bollinger Band, ranging from 0% (top) to 100% (bottom). Setting this helps you control at what point within the band actions like selling should occur. |
Indicators
| Label | Config Parameter | Default Value | Detailed Description |
|---|---|---|---|
| Period | PERIOD | 15 | The period setting defines the duration, in minutes, of candlesticks used in calculating indicators. Ensure that the period you select is supported by your trading exchange. Typical settings might range from 1 minute for high-frequency trading scenarios to longer periods for less volatile strategies. |
| SMA period | SMAPERIOD | 30 | Defines the number of candles used to calculate the Simple Moving Average (SMA), which is used to calculate Bollinger Bands. Longer periods will smooth out price data more, reducing the responsiveness to price changes but potentially filtering out noise. |
| Standard deviation | STDV | 2 | The standard deviation multiplier determines the width of the Bollinger Bands. A higher value increases the gap between the bands, which might be useful in more volatile markets to avoid premature buy or sell signals. |
| Medium EMA | EMA1 | 16 | The number of candles used to calculate the medium-term Exponential Moving Average (EMA). This EMA is critical for detecting trends over a moderate timeframe, providing a balance between short-term fluctuations and long-term trends. |
| Fast EMA | EMA2 | 8 | The fast EMA setting uses fewer candles to calculate, making it more responsive to recent price changes. This setting helps traders react quickly to new trends or reversals as they develop. |
| Mean reversion | MEAN_REVERSION | true | Enabling this feature adjusts the strategy to capitalize on mean reversion tendencies in the market, where prices tend to return to a mean or average level after significant movements. This can be particularly effective in range-bound or oscillating market conditions. |