BBTA (futures)
Bollinger Bands are a technical analysis indicator that help identify relative high and low prices. Using this information, you can potentially buy at lower prices and sell at higher prices.
The indicator consists of three lines: the middle line is a simple moving average, and the other two lines are plotted above and below it at a certain distance away. This distance is calculated using standard deviation, which measures how much the price has varied from its average value over a given period of time. The wider the distance between the upper and lower bands, the higher the volatility of the price.
To use Bollinger Bands TA as method in Gunbot, you can configure at which percentage from the lower band to buy and at which percentage from the upper band to sell. Orders are placed after the price moves outside the set level and then moves back in. Keep in mind that Bollinger Bands are just one tool among many for analyzing the markets, so make sure you understand how they work before relying on them for trading decisions.
How to work with it
This page explains how futures trading operates with the bbta method. The triggers for trades differ slightly from those used in spot trading.
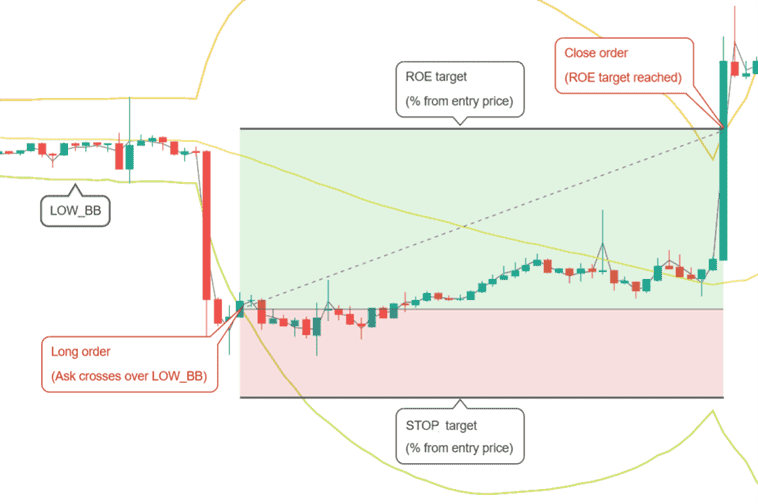
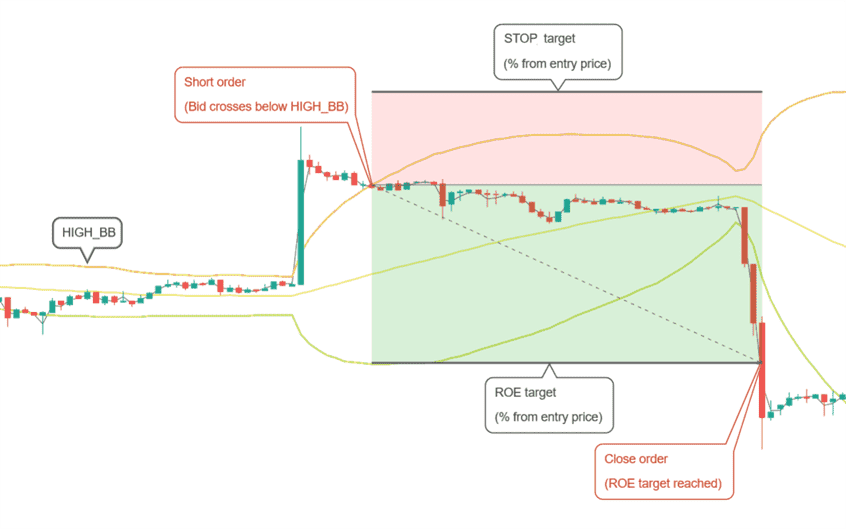
Gunbot opens a single position, either long or short, and closes it when the target is met. If the stop is triggered before closing the trade at a profit, Gunbot will place a stop order at a loss. After closing a position, Gunbot will seek to open a new long or short position.
Buy method conditions

A long position is opened when the ask price crosses over LOW_BB. In the example above LOW_BB would be set to 0, which represents the actual lower Bollinger Band. With different values you could set a target above (positive value) or below (negative value) the lower band.
Sell method conditions

A short position is opened when the bid price crosses below HIGH_BB. In the example above HIGH_BB would be set to 0, which represents the actual upper Bollinger Band. With different values you could set a target below (positive value) or above (negative value) the upper band.
Conditions to close
Position is closed when the desired ROE (return on equity) is reached. This is a percentage from the entry point, taking leverage into consideration.
Conditions to stop
A position is closed at loss when negative ROE reaches the STOP_LIMIT target.
BBTA strategy settings (futures)
Long settings
| Label | Config Parameter | Default Value | Detailed Description |
|---|---|---|---|
| Buy enabled | BUY_ENABLED | true | Enables you to place buy or long orders, allowing you to enter the market by purchasing assets. |
| Low BB | LOW_BB | 0.1 | The target for the Low Bollinger Band. It is defined as a percentage from 0 to 100, indicating the position from the bottom to the top of the band. |
Short settings
| Label | Config Parameter | Default Value | Detailed Description |
|---|---|---|---|
| Sell enabled | SELL_ENABLED | true | Enables you to place sell or short orders, allowing you to enter the market by selling assets you do not currently hold. |
| High BB | HIGH_BB | 0.1 | The target for the High Bollinger Band. It is defined as a percentage from 0 to 100, indicating the position from the top to the bottom of the band. |
Indicators
| Label | Config Parameter | Default Value | Detailed Description |
|---|---|---|---|
| Period | PERIOD | 15 | Specifies the duration of the candlesticks in minutes that are used for calculating the indicators. It is essential to ensure that your exchange supports the selected period value. |
| SMA period | SMAPERIOD | 30 | Determines the number of candlesticks used to calculate the Simple Moving Average, which forms part of the Bollinger Bands calculations. |
| Standard deviation | STDV | 2 | Sets the multiplier for calculating the width of the Bollinger Bands. A higher value results in wider bands, potentially capturing more significant price movements but also increasing the risk of false signals. |
| Mean reversion | MEAN_REVERSION | true | Enables the mean reversion trading method, which assumes that the price will revert to its average value over time, a common strategy in range-bound markets. |