Monitoring and Tracking Performance

Having a clear overview of your Gunbot strategies' performance is essential for continuous improvement. The better you understand what is happening, the better you will be able to improve what the trading bot is doing for you. we'll introduce you to some of the tools and techniques that can help you monitor and track your trading performance effectively.
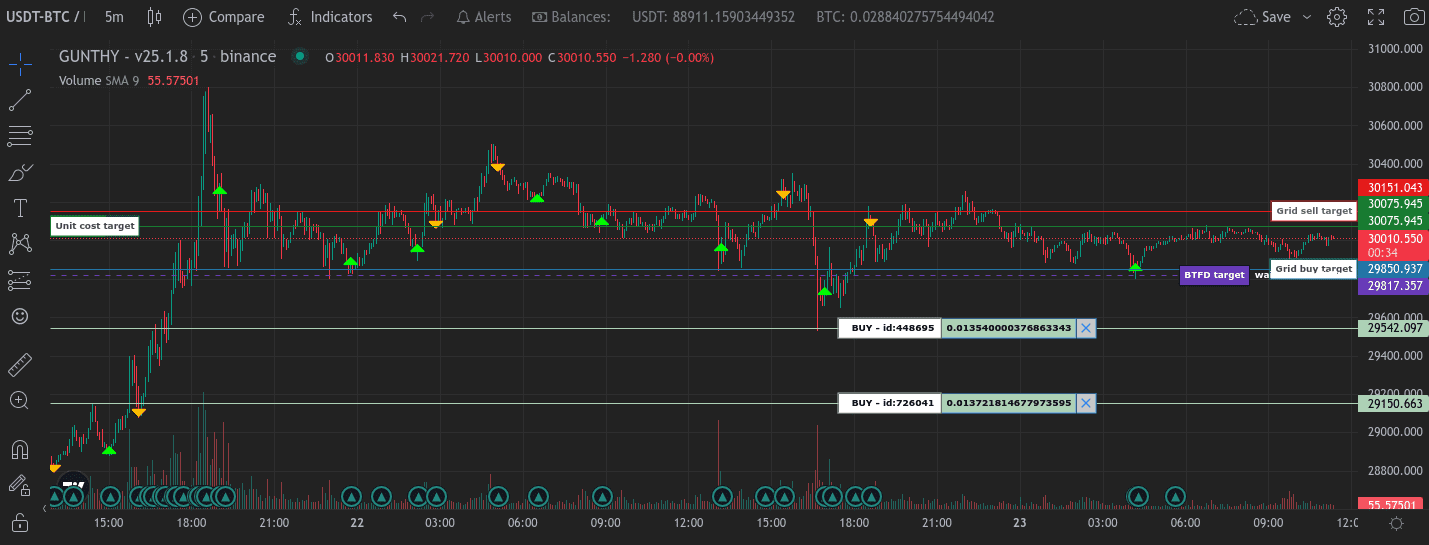
Visualize Trades on the Trading Chart 📊
A picture is worth a thousand words, and that's especially true when it comes to analyzing trading data. Gunbot allows you to visualize all trades directly on the trading chart. This makes it easy to spot trends, entry and exit points, and overall strategy performance at a glance. Use these visual cues to assess your trading decisions and make necessary adjustments along the way.
tip
By closely examining the trading chart, you can quickly identify patterns and trends in your trading performance.
Monitor Open Positions with ROE % 🔍
One key metric to keep an eye on is the Return on Equity (ROE) percentage, which represents your unrealized Profit and Loss (PNL) for open positions. Gunbot provides this feature so you can easily track how your current trades are performing. A positive ROE % indicates a profitable position, while a negative value suggests a loss. Pay attention to this metric as you make future trading decisions.
tip
Because most trading strategies sell when a position is in profit, it is common to see mostly negative ROE values in the overview for active trading pairs. Pairs spend a lot of time in the red, until they are green and sell.
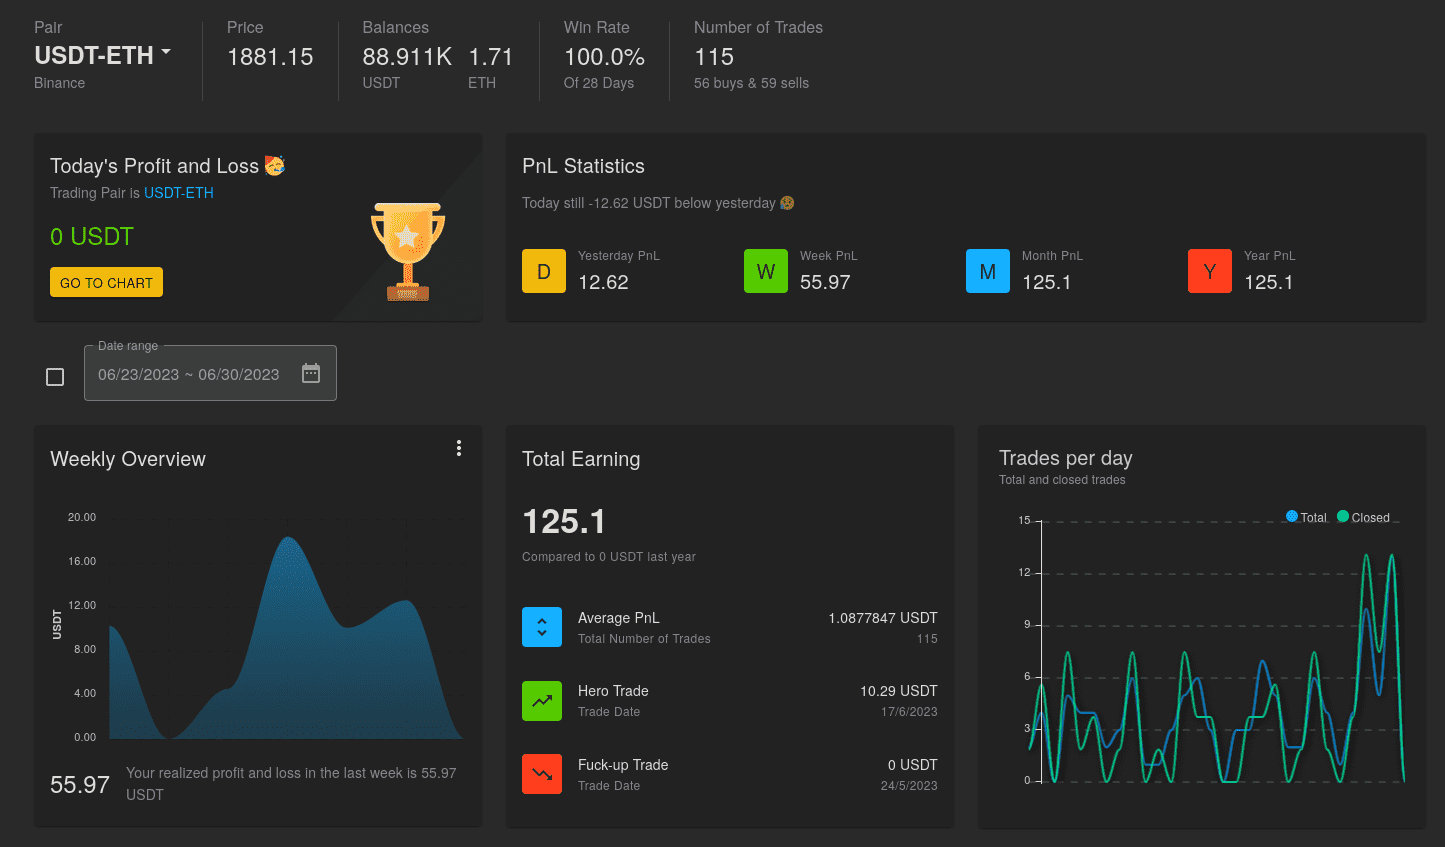
Review Dashboard Statistics 📉
Gunbot's dashboard offers detailed historical statistics such as cumulative PNL, the number of trades executed, and other valuable metrics. Use these stats to gain insights into long-term trends and the overall success of your trading strategies. Regularly review these numbers to stay informed and make data-driven adjustments to your approach.
info
Your dashboard holds the key to understanding your trading performance. Analyze the provided data to uncover hidden gems of information that can strengthen your strategies.
Improve Performance Through Systematic Analysis 🧠
Now that you have the tools to monitor and track your Gunbot trading performance, it's time to put them into action. Use the provided statistics and ROE % to identify areas of improvement in your strategy. Experiment with different parameters and settings in Gunbot to see how they impact your performance.
When making adjustments, consider these steps:
- Identify patterns and trends in your trading data (e.g., recurring losses or profits).
- Determine potential causes for these trends by analyzing trade entries, exits, and other factors.
- Implement changes to your strategy based on your findings.
- Track the results of your changes over time and make further adjustments as needed.
It's important to remember that trading is a dynamic process, so be prepared to adapt and refine your strategies continuously.
Final Thoughts 💡
Mastering your Gunbot strategies requires ongoing monitoring and tracking of your trading performance. By using the trading chart, ROE %, and dashboard statistics, you can see what is working, spot weak areas, and adjust your setup with evidence instead of guesses.