Visualize Your Strategy: Gunbot's Chart Drawing Tools

Visualizing a trading strategy helps you debug it and explain it. Gunbot gives you chart drawing tools that support strategy development and make the data easier to read for casual traders. Let's look at how you can use these tools in your custom strategies.
This guide looks at how to make use of programmatic chart drawings for realtime strategy visualization.
1. Visualizing Support and Resistance with Labeled Rectangles
When you're looking to mark out support and resistance channels, labeled rectangles can be incredibly useful. Here's how you can create them:
// Initialize an array to store shapes
let newChartShapes = []

// Example data for rectangles
const exampleRectangleData = [
    {
        top: 12,
        bottom: 10,
        endTime: 1234567890, // timestamp in seconds
        label: '15M channel'
    },
    {
        top: 16,
        bottom: 15.5,
        endTime: 1234567890, // timestamp in seconds
        label: '4H channel'
    }
]

let boxLabels = []

const boxes = exampleRectangleData.map((data, index) => {

    const isSupport = gb.data.bid >= data.top
    const isResistance = gb.data.bid <= data.bottom

    // Create labels for the rectangles
    boxLabels.push({
        points: [
            { price: data.top, time: data.endTime },
        ],
        options: {
            text: data.label,
            shape: 'text',
            lock: true,
            disableSelection: true,
            setInBackground: true,
            overrides: {
                backgroundColor: 'rgba(25,83,55,0.0)',
                color: isSupport ? '#195337' : isResistance ? '#592e2e' : '#193253',
                fillBackground: false,
            }
        }
    })

    // Create rectangles with the specified options
    return {
        // Define rectangle points (top-left and bottom-right corners)
        points: [
            { price: data.top, time: 0 },
            { price: data.bottom, time: data.endTime },
        ],
        options: {
            shape: 'rectangle',
            lock: true,
            disableSelection: true,
            setInBackground: true,
            overrides: {
                backgroundColor: isSupport ? 'rgba(25,83,55,0.25)' : isResistance ? 'rgba(89,46,46,0.25)' : 'rgb(25,50,83, 0.25)',
                color: isSupport ? '#195337' : isResistance ? '#592e2e' : '#193253',
                fillBackground: true,
            }
        }
    };
});

// Combine the shapes and labels
newChartShapes = [...newChartShapes, ...boxes, ...boxLabels]

// Update the chart with the new shapes
gb.data.pairData.customChartShapes = newChartShapes
By using the above code, you can create clear visual markers for your strategy's support and resistance levels.
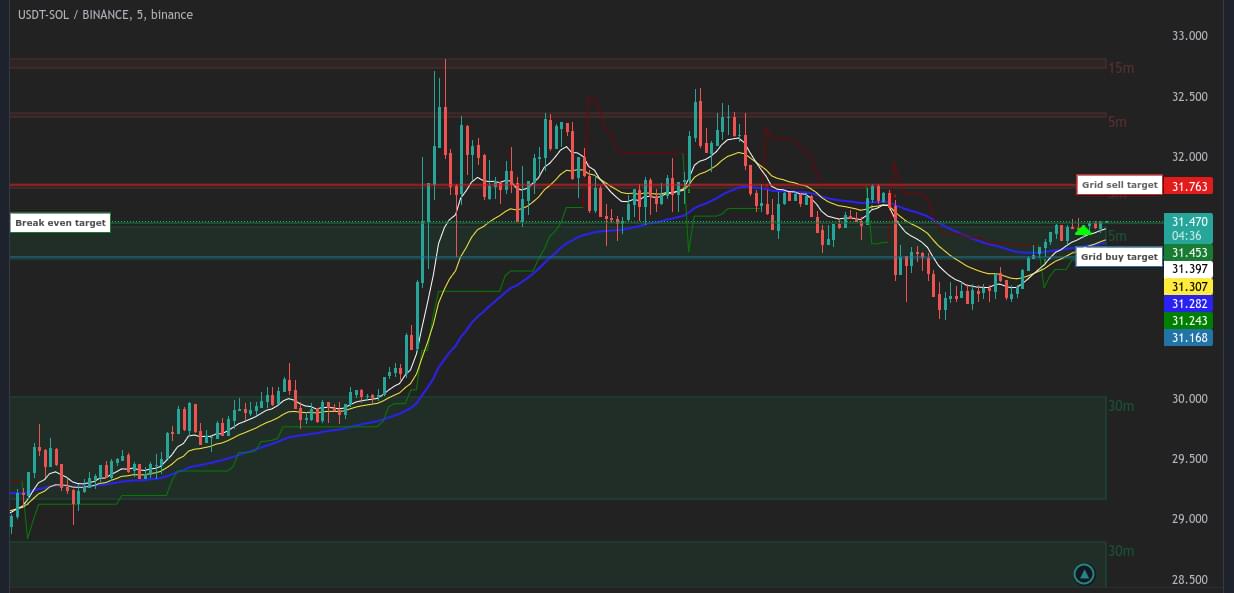
2. Setting Clear Targets with Target Lines
note
Target lines are horizontal lines with price and amount properties. They can help visualize specific targets, like breakout or pullback targets.
// Initialize an array to store target lines
let newChartTargets = []

// Define target lines with properties
const customRangeTargets = [
        {
            text: 'Breakout target',
            price: 100,
            quantity: 2, // setting an empty string '' omits the quantity field
            lineStyle: 2, // 0: solid, 1: dotted, 2: dashed
            lineLength: 0, // 0 (right) - 100 (left)
            extendLeft: true,
            //...rest of the code
        }
    ]
// Add the target lines to the array
newChartTargets = [...newChartTargets, ...customRangeTargets]

// Update the chart with the new target lines
gb.data.pairData.customChartTargets = newChartTargets
With these target lines, you can easily visualize and track your strategy's price objectives.
3. Area: Highlighting Areas of Interest
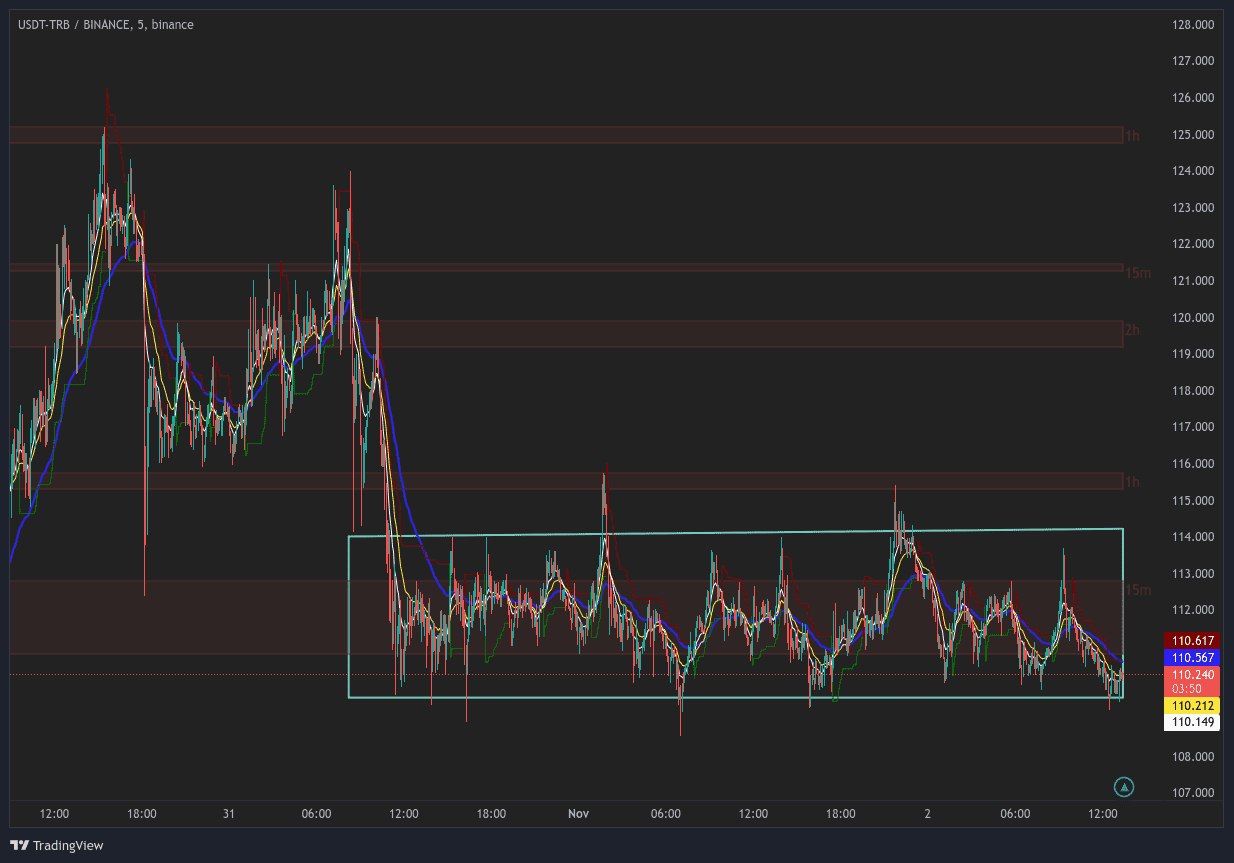
Sometimes you want to highlight a specific area on the chart to draw attention to it. Here's how you can outline an area:
// Initialize an array to store shapes
let newChartShapes = []

// Define the area with points
const exampleAreaData = {
    upperLeft: 118,
    upperRight: 120,
    lowerRight: 116,
    lowerLeft: 114,
    startTime: 0, // timestamp in seconds
    endTime: gb.data.pairData.candles.open[gb.data.pairData.candles.open.length - 1].timestamp // Assuming the area ends at the last bar
};

// Create the area shape
const area = {
    points: [
        { price: exampleAreaData.upperLeft, time: exampleAreaData.startTime },
        { price: exampleAreaData.upperRight, time: exampleAreaData.endTime },
        { price: exampleAreaData.lowerRight, time: exampleAreaData.endTime },
        { price: exampleAreaData.lowerLeft, time: exampleAreaData.startTime },
        { price: exampleAreaData.upperLeft, time: exampleAreaData.startTime },
    ],
    options: {
        shape: 'path',
        lock: true,
        disableSelection: true,
        setInBackground: true,
        overrides: {
            lineColor: '#70ccbd'
        }
    }
};

// Add the area to the shapes array
newChartShapes = [...newChartShapes, area]

// Store the new shapes for the chart to display
gb.data.pairData.customChartShapes = newChartShapes
This method allows you to create a visual emphasis on the chart, making it easier to spot patterns or areas of interest.
4. Custom Metrics for In-Depth Analysis
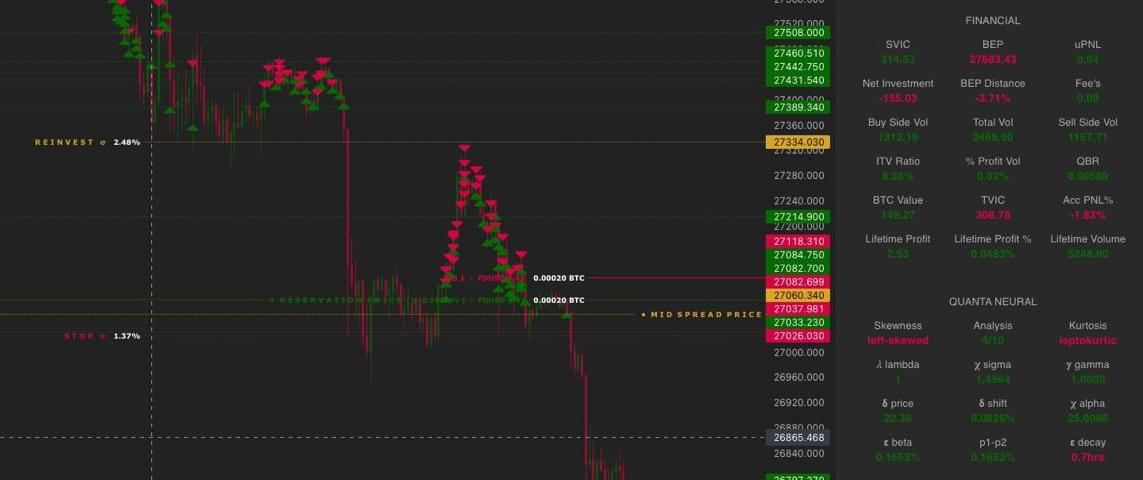
Gunbot allows developers to create their own metrics and display them next to the chart, providing a more detailed picture of the strategy's performance.
// Initialize an array to store metrics
let newChartMetrics = []

// Define your custom metrics
const metrics = [
    {
        label: `Metric name`,
        value: '110',
        tooltip: 'Display this text as a tooltip for this custom metric.'
    },
    // Add more metrics as needed
]

// Add the metrics to the array
newChartMetrics = [...newChartMetrics, metrics]

// Update the chart sidebar with the new metrics
gb.data.pairData.sidebarExtras = newChartMetrics
By adding custom metrics, you can track specific aspects of your strategy directly on the chart, making it easier to make informed decisions.
These are just some highlights of the drawing tools for custom strategies. There is plenty more to discover.
Gunbot's chart drawing tools give you a practical way to visualize trading strategies. If you're a developer debugging algorithms or a trader checking strategy execution, these tools make the chart easier to read. A clear chart makes strategy behavior easier to debug, explain, and trust.